A Premier League match often leaves a familiar residue. The score is clear, the standout moments are easy to remember, but the match still feels only half understood. A team can win while looking unstable. Another can lose despite controlling long stretches. Manchester City can appear dominant in possession, yet the underlying story may sit in where they regain the ball, which lanes they occupy after the regain, and whether their structure survives the next transition.
That gap between what happened and why it happened is where premier league football analysis begins. Professional analysis doesn't treat tactics, numbers, and clips as separate hobbies. It fuses them into one working process. The tactical eye notices a pattern. The data tests whether the pattern is repeatable. The video confirms whether the numbers describe the right thing.
That matters more now because the league has become far easier to study over time. Publicly available Premier League data on DataHub spans 32 seasons from 1993 to 1994 to the current season, giving analysts a historical base that supports cross-era comparison and long-run context for modern tactical debates (DataHub's Premier League dataset overview). That kind of continuity changes the standard of analysis. It moves the conversation away from isolated talking points and toward durable patterns.
A junior analyst stepping into this field doesn't need louder opinions. That analyst needs a workflow. The useful questions are practical ones. What should be watched first in possession? Which metrics matter? How should clips be tagged so the coaching staff can use them? Why does a team's structure look different late in matches or during congested periods?
Table of Contents
- THE THREE PILLARS OF MODERN FOOTBALL ANALYSIS
- UNDERSTANDING THE KEY PERFORMANCE METRICS
- HOW TO READ PATTERNS OF PLAY
- CASE STUDY MANCHESTER CITYS TACTICAL EVOLUTION
- PRACTICAL TAKEAWAYS FOR COACHES AND FANS
- CONCLUSION
THE THREE PILLARS OF MODERN FOOTBALL ANALYSIS
At club level, analysis works like an investigation. One source of evidence is never enough. A shape on the pitch can mislead. A metric can flatten context. A video clip can overemphasize one moment. The answer comes from alignment across all three.
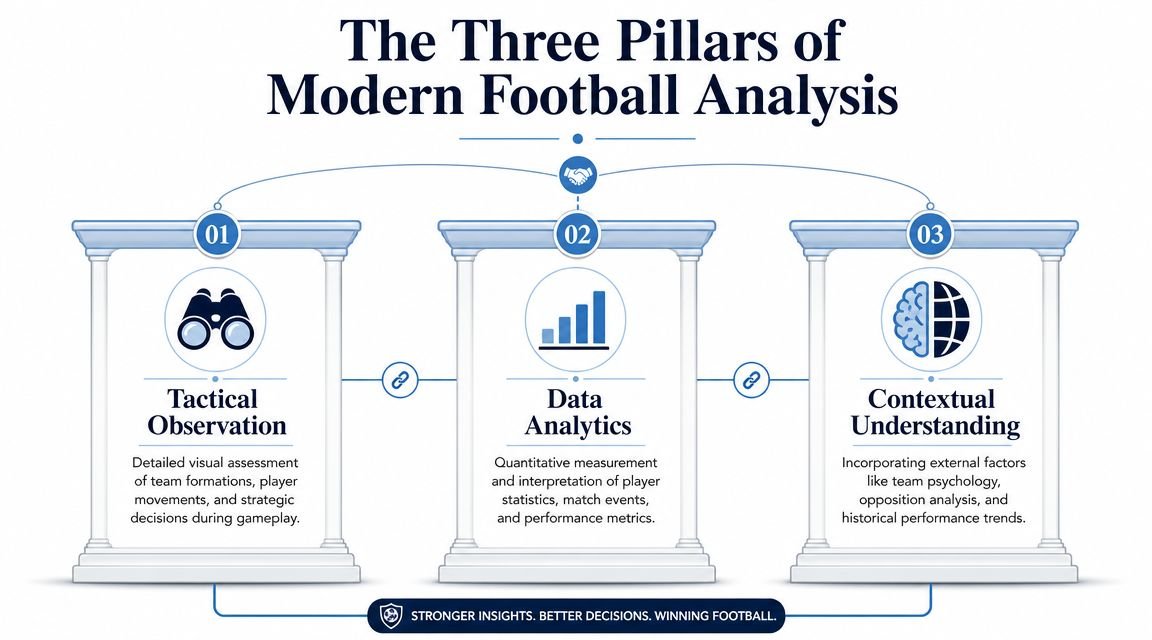
Tactical Observation
Tactical analysis starts with structure. The first task is to identify how a team organizes each phase.
That means logging details such as:
- Build-up shape: Is the team using a back three in first phase, or dropping a midfielder to create the extra line?
- Rest defense: How many players remain behind the ball when attacks develop, and where are they positioned?
- Pressing triggers: Does the press jump on a backward pass, a touch to the full-back, or a slow central reception?
- Final-third occupation: Which zones are consistently filled, and which are being left vacant?
For Manchester City, that usually means watching more than the nominal formation. The printed lineup rarely tells the truth once possession settles. A full-back may move inside, a center-back may step into midfield, and the wide player may hold the touchline only to open the half-space for another runner.
Data Analysis
The second pillar asks whether the tactical read survives scrutiny. Elite football departments don't stop at post-match stat sheets. They work through extraction, transformation, and presentation so coaches can review opponent trends, physical loads, and key match factors through integrated dashboards and data pipelines (football data workflow and dashboard process).
That workflow matters because data answers different questions than the eye does.
| Analytical Task | What The Analyst Wants To Know | Typical Evidence |
|---|---|---|
| Territory | Where did the game live? | field position, recoveries, entries |
| Chance quality | Were chances actually dangerous? | shot quality models |
| Pressing impact | Did the press alter possession? | pressure and turnover patterns |
| Opponent adaptation | Did structure change after a trigger? | split-match event review |
Practical rule: If the tactical note can't be tested, it isn't analysis yet. It's only a hypothesis.
Video Analysis
Video closes the loop. A number may show that a side created better chances after high regains. The clips reveal whether those regains came from an organized trap, an opponent error, or a sequence the staff can coach.
Useful video work usually follows a simple method:
- Tag the phase rather than the outcome alone.
- Sort clips by repeatability, not drama.
- Pair every key clip with one question the staff needs answered.
- Build short playlists for coaches, because long edits dilute attention.
A junior analyst should think in linked evidence. Tactical observation identifies the possible story. Data tests it. Video turns it into something coaches and players can act on.
UNDERSTANDING THE KEY PERFORMANCE METRICS
Traditional stats still have value, but they're often blunt instruments. Possession can reflect control, sterile circulation, or game state. Total shots can reward volume while ignoring quality. A side taking speculative efforts from poor positions can look active while creating very little threat.
That's why modern Premier League analysis leans on a smaller set of metrics with stronger explanatory value. Industry coverage consistently centers xG, xGA, and PPDA because they offer a more stable picture of performance than raw finishing or possession alone (advanced Premier League metrics explained).
What The Main Metrics Actually Answer
The easiest way to teach metrics is to attach each one to a football question.
| Metric | Abbreviation | What It Measures |
|---|---|---|
| Expected Goals | xG | The quality of shots a team creates |
| Expected Goals Against | xGA | The quality of shots a team concedes |
| Passes Per Defensive Action | PPDA | How aggressively a team presses before allowing opposition passes |
xG asks, “How good were the chances?” It doesn't care whether the shot was finished. It cares about the chance profile.
xGA asks the same question from the defensive side. Teams often concede fewer goals than their process deserves for short spells. xGA helps separate defensive structure from temporary shot-stopping or poor opponent finishing.
PPDA asks, “How much uncontested circulation did the opponent get before defensive pressure disrupted it?” Lower values generally indicate more aggressive pressing, but its true analytical value comes from linking that pressure to where possession is recovered and what happens immediately after.
Why These Metrics Matter More Than Surface Stats
A useful analyst treats metrics as filters, not verdicts. If a side posts high possession but weak chance quality, the possession may be decorative. If another side records fewer shots but stronger xG, its attack may be more efficient and more repeatable.
That's particularly useful when reviewing match previews and post-match breakdowns such as this RB Leipzig vs Manchester City statistical preview, where the numbers become more meaningful once they're tied back to structure and game model rather than used as stand-alone talking points.
The best metric isn't the one that sounds advanced. It's the one that helps the staff make a better football decision.
What A Junior Analyst Should Avoid
A few mistakes appear repeatedly in early analytical work:
- Treating xG like a scoreline correction: It's a chance-quality tool, not a moral verdict on who “deserved” to win.
- Reading PPDA without context: A low figure can reflect a coherent press, but it can also reflect game state or opponent build-up choices.
- Confusing output with process: Goals, assists, and possession describe events. Process metrics explain whether those events are likely to persist.
A strong report doesn't list every available number. It selects the few that explain the tactical problem under review.
HOW TO READ PATTERNS OF PLAY
Most analysts improve when they stop asking, “Who played well?” and start asking, “What pattern kept appearing?” Patterns matter because they travel from match to match. Isolated moments don't.
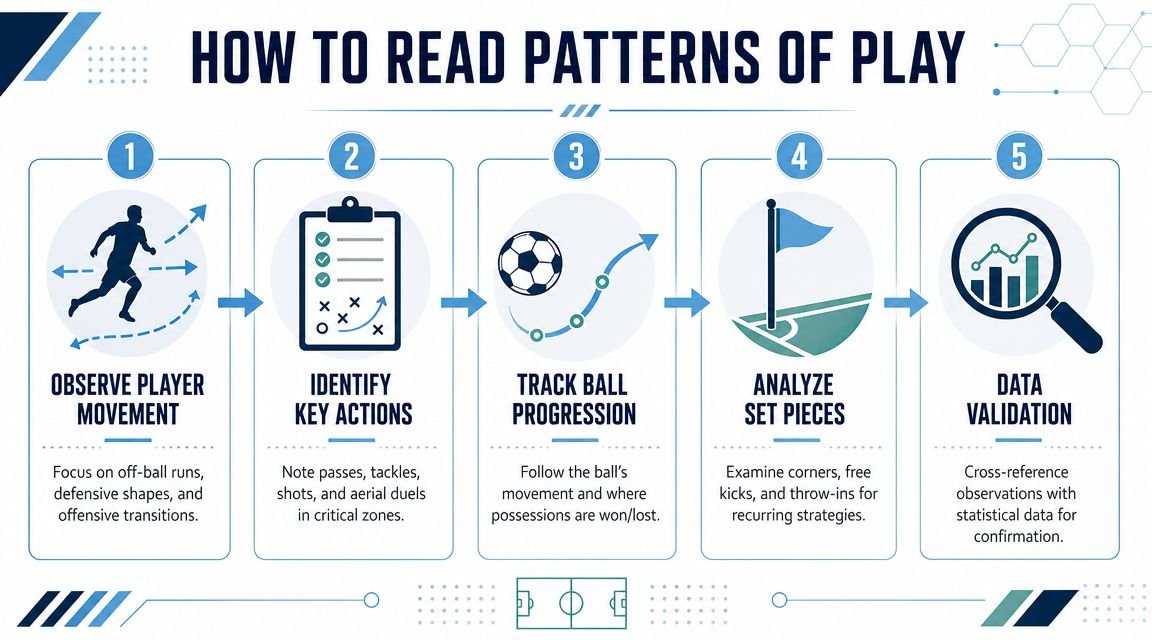
A clean way to read a match is phase by phase. Start with the first build-up line, then move to progression, then final-third occupation, then defensive rest shape, then transition behavior. That order reduces noise.
If The Eye Sees X, Check Y
At this point, tactical reading becomes operational.
- If the eye sees repeated high regains, check whether the match profile also suggests pressure converting into dangerous attacks. Models that combine xG, PPDA, and related process indicators are valuable because higher regains often lead directly to high-quality chances and help distinguish durable control from short-term scoreline variance (how xG and PPDA combine in match models).
- If the eye sees a back line stretching to protect wide channels, review whether the opponent is manipulating the half-spaces through third-man combinations rather than simple wing play.
- If the eye sees sterile possession, test whether territory is turning into central access or quality shots.
- If the eye sees chaos after turnovers, isolate the rest-defense structure just before possession is lost.
A junior analyst should think in paired prompts: observation first, validation second.
Reading Shape During The Match
The most useful live notes are usually short and specific.
| Match Phase | What To Watch | Why It Matters |
|---|---|---|
| First phase build-up | spare man, goalkeeper role, full-back height | reveals access route through press |
| Midfield progression | body orientation, receiving lane, support distance | shows whether circulation can break lines |
| Final third | width, occupation of half-spaces, cutback zone access | identifies chance-creation mechanism |
| Defensive transition | nearest presser, cover shadows, second line reaction | shows whether control survives turnovers |
A shape should also be read as a sequence, not a still image. A nominal 4-2-3-1 can behave very differently depending on where the wingers defend, where the pivot receives, and whether the full-backs invert or overlap. That's why a reference point like this guide to the 4-2-3-1 formation is useful only when matched to real movement patterns.
A short visual review helps here before numbers are finalized.
Watch the player furthest from the ball. That player often reveals the actual attacking plan before the ball gets there.
What Counts As A Real Pattern
A real pattern has three features:
- It repeats in similar phases.
- It creates a consistent advantage such as free progression, cleaner receptions, or better shot locations.
- It survives clip review, meaning the same mechanism appears from multiple possessions.
That standard protects analysts from building conclusions on highlight moments. Premier league football analysis gets stronger when the report follows repeatable mechanisms, not memorable scenes.
CASE STUDY MANCHESTER CITYS TACTICAL EVOLUTION
Manchester City remain the clearest Premier League case study because the side's apparent complexity is usually just disciplined positional logic expressed at high speed. The challenge for an analyst isn't spotting that City want control. The challenge is identifying which version of control they're using in a given match.
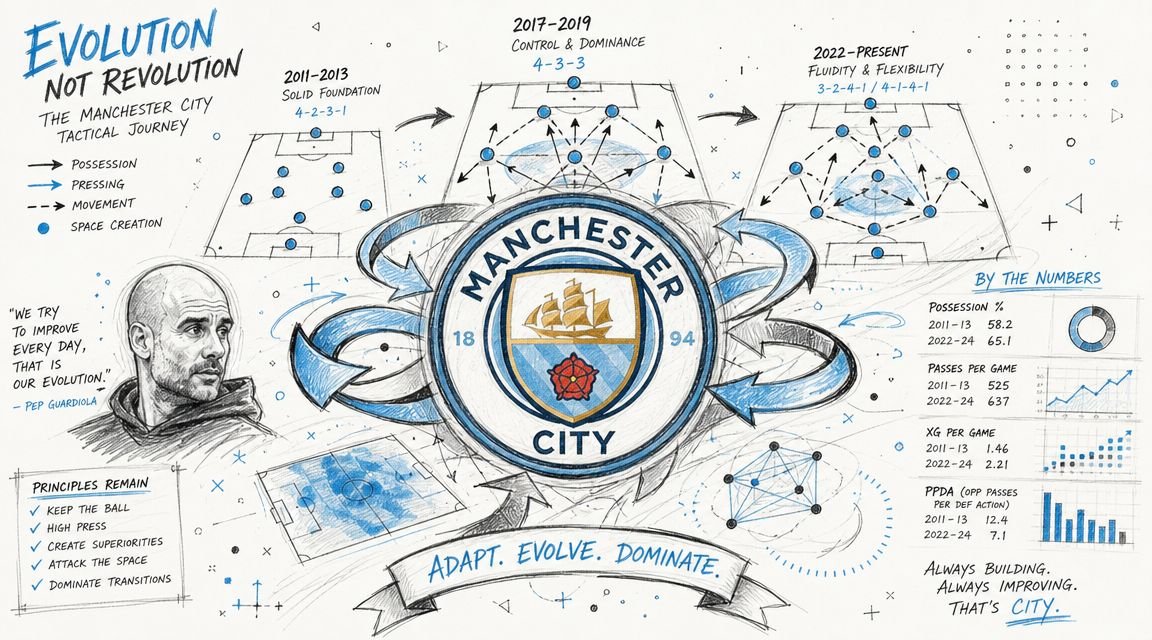
The Core Principle
City's baseline idea is positional play. Space is managed before it is attacked. Width pins. Interior occupation creates passing angles. Rest defense protects the next action before the current one ends.
For a junior analyst, that means the first task is never “find the formation.” The first task is “find the reference points.” Which players hold width? Who secures the center? Which line gives the spare man in build-up? Which pair protects the counter?
The Adaptation That Changes The Picture
One recurring City adaptation has been the use of asymmetry. A full-back may step inside next to the pivot, or a center-back may advance into midfield while the opposite side holds a more traditional line. On paper, those are minor changes. In practice, they alter everything:
- the pressing bait shown to the opponent
- the angle of progression into the half-space
- the rest-defense shape after a lost ball
- the receiving conditions for the forwards
That's why broad labels can fail. “City dominated possession” doesn't explain whether they used the ball to pull a midfield line outward, create central superiority, or secure second balls around the box.
This kind of match-specific adjustment is easier to understand through detailed tactical breakdowns such as Manchester City's adaptation to West Ham's approach, where structural tweaks matter more than formation graphics.
A Practical Match Reading
Consider a familiar City match pattern rather than a single result. The opponent starts in a compact mid-block. City circulate across the back line. The full-back on one side moves infield. The far winger stays high and wide. A central midfielder drifts into the half-space to receive between lines. The opponent's wide midfielder now has a choice. Follow inside and leave the flank. Stay wide and concede the interior lane.
That sequence is where the analyst should work.
First, tag every reception in the half-space that comes after an interior rotation. Second, review whether those receptions lead to cutbacks, shots, or forced defensive collapses. Third, isolate the moments when the move breaks down. Was the issue timing, spacing, or the opponent's cover mechanism?
A junior analyst should also note what happens on loss. If City lose possession with both full-backs high, the story changes. If one side remains structurally conservative and the nearest midfielder counterpresses immediately, the same attacking pattern becomes safer and more sustainable.
The real tactical evolution isn't always a new shape. Often it's a better balance between access, occupation, and protection.
What This Teaches About Analysis
Manchester City are a useful teaching case because they punish lazy interpretation. Possession alone doesn't explain them. Neither do raw shot counts. Their matches often hinge on how well structure turns territorial control into quality access while preserving defensive security after turnovers.
That is the broader lesson. Strong analysis doesn't ask whether a team had the ball. It asks what the ball did for the team's structure.
PRACTICAL TAKEAWAYS FOR COACHES AND FANS
A good analytical process should change decisions. If it doesn't, it's decoration. Coaches, supporters, writers, and fantasy or betting readers all use different language, but they benefit from the same discipline: separate process from outcome.
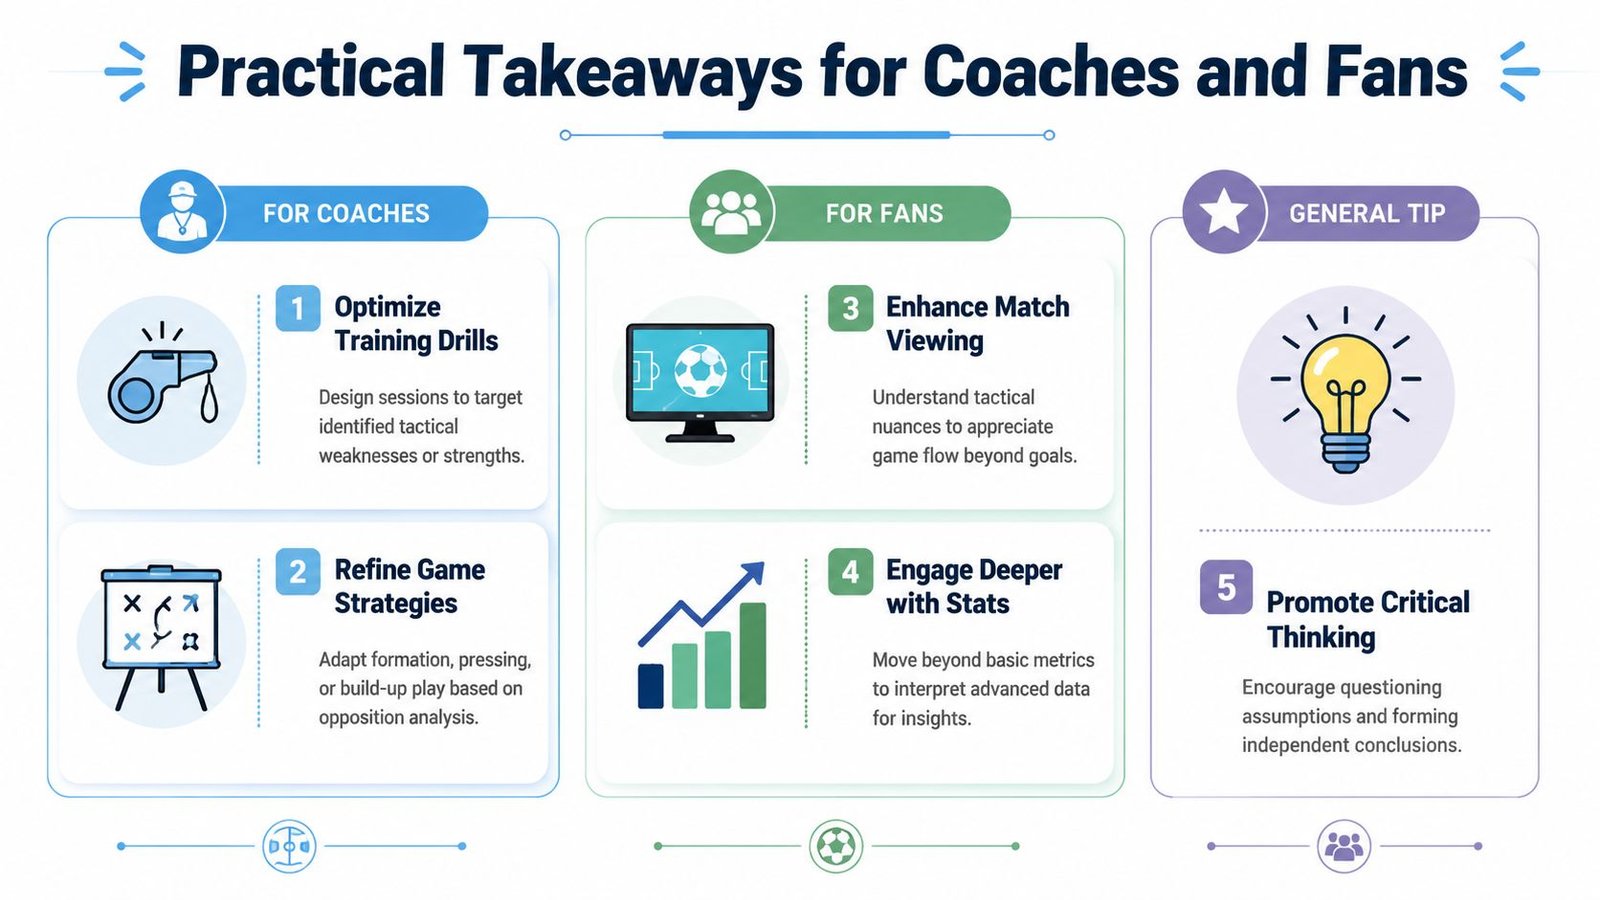
For Coaches And Analysts
The most reliable use of analysis is opponent preparation.
- Build reports by phase: Split notes into build-up, defensive transition, settled defense, and attacking patterns. Coaches can act on phase-specific problems faster than broad summaries.
- Clip the recurring mechanism: Don't send ten chances if three all came from the same weakness.
- Add the physical question: Sports-science work on Premier League demands reports that players are in purposeful movement for about 40.6% of match time, with frequent transitions, which is a useful reminder that aggressive tactical ideas are constrained by physical cost (Premier League match-demand study).
That last point is often missed. A team's apparent loss of control isn't always conceptual failure. It can be a load-management response inside a demanding schedule.
For Fans, Writers, And Fantasy-Oriented Readers
The strongest habit is to stop chasing only the final action.
- Watch the action before the action: How was the chance created? Through overload, regain, switch, or second ball?
- Track roles, not shirt numbers: The same player can perform different functions across phases.
- Use specialist resources carefully: Editorial sites such as Manchester City Analysis provide tactical breakdowns and opinion on City's structure, player roles, and match adaptations, which can help readers test their own observations against a detailed football lens.
For readers who also publish analysis, writing quality matters almost as much as tactical insight. A practical reference like Outrank's guide to sports article writing is useful because clear reporting often depends on framing evidence in a way non-analysts can follow.
One Contrarian Habit Worth Keeping
Many debates become cleaner when the analyst asks a less fashionable question: was the idea wrong, or was the team unable to sustain the idea?
That distinction improves scouting reports, match reviews, and public discussion. It also makes premier league football analysis more honest. Not every tactical problem is solved on a tactics board.
CONCLUSION
The strongest football analysis doesn't come from choosing between the eye test and the numbers. It comes from combining tactical frameworks, data evidence, and video validation into one repeatable workflow. That's the standard used inside elite environments, and it's the standard that makes match interpretation more useful.
A junior analyst studying the Premier League should keep the process simple. Start with structure. Identify recurring patterns in build-up, progression, final-third occupation, and defensive transition. Use a small group of meaningful metrics to test whether those patterns describe sustainable performance. Then return to the video and confirm the mechanism, not just the outcome.
Manchester City provide a clear model for this way of thinking because their matches reward precision. Their control is rarely just about possession. It comes from how space is occupied, how pressure is applied, and how rest defense protects the next moment. That's why their games are so useful for analytical training.
The field will keep moving toward faster feedback loops, smarter dashboards, and more real-time support during matches. But the core principle won't change. Good analysis still depends on asking the right question, finding the right evidence, and presenting it in a form coaches and informed supporters can use.
Readers who want regular tactical breakdowns, match analysis, and opinion focused on Manchester City can explore Manchester City Analysis for deeper coverage of how elite football ideas show up in real matches.