A lot of supporters already do the first half of analysis without realising it. They watch a Premier League match, notice that one full-back keeps stepping inside, or that a press suddenly disappears after the opening stretch, or that a team looks secure until one midfielder goes missing. The feeling is clear. The language and structure often aren't.
That gap matters. Without a method, observation turns into loose opinion. With a method, the same match becomes readable. A passing sequence becomes a build-up pattern. A bad spell after losing the ball becomes a defensive transition issue. A run of wins becomes something that can be tested against the underlying process instead of accepted at face value.
Professional premier league team analysis isn't one spreadsheet, one heat map, or one clip package. It's a workflow. The strongest reports start with a sharp question, combine event data with video, separate the game into phases, and finish by translating all of that into decisions. Sometimes the decision is tactical. Sometimes it's squad-related. Sometimes it confirms that the result lied.
Manchester City make a useful case study because their structure is so clear when it works and so revealing when one key role disappears. That makes them ideal for showing how analysts move from raw data to a practical football conclusion.
Table of Contents
- INTRODUCTION
- DEFINING YOUR ANALYTICAL OBJECTIVES
- ASSEMBLING YOUR DATA AND ANALYTICAL TOOLS
- ANALYZING TACTICAL SHAPES AND PHASES OF PLAY
- MASTERING SET-PIECE AND TRANSITION ANALYSIS
- A WORKED EXAMPLE A TACTICAL ANALYSIS OF MANCHESTER CITY
- BEYOND THE STATS DEVELOPING YOUR ANALYTICAL EYE
INTRODUCTION
The fastest way to improve premier league team analysis is to stop asking whether a team played well and start asking in which phase they controlled the game, where that control came from, and whether it was repeatable.
That change sounds small, but it alters everything. It forces attention onto structure instead of highlights. It makes a viewer track spacing, rest-defense, build-up support, and access to the final third instead of relying on goals, possession, and post-match narratives.
Manchester City offer the perfect training ground for this approach. Their matches are rarely random. When they dominate, the reasons usually sit in spacing, circulation, role clarity, and immediate pressure after losing the ball. When they wobble, the cracks often show up in the same places. That consistency makes them ideal for learning a professional workflow.
Good analysis doesn't begin with a conclusion. It begins with a question that can survive contact with video.
A strong process usually follows a simple order:
- Define the question: Is the focus one match, a sequence of matches, or a full-season trend?
- Collect evidence: Event data, tracking-style observations, and tagged clips all matter.
- Break the game into phases: In possession, out of possession, offensive transition, defensive transition.
- Write the football meaning: What happened, why it happened, and whether it should persist.
That workflow is what turns passive viewing into analysis that a coach, scout, journalist, or serious supporter can effectively use.
DEFINING YOUR ANALYTICAL OBJECTIVES
A weak report usually fails before the first clip is cut. The problem isn't effort. It's that the question is too broad. "Analyse Manchester City" isn't an analytical objective. It's a topic. "Why did City's rest-defense fail against direct attacks?" is a usable objective.
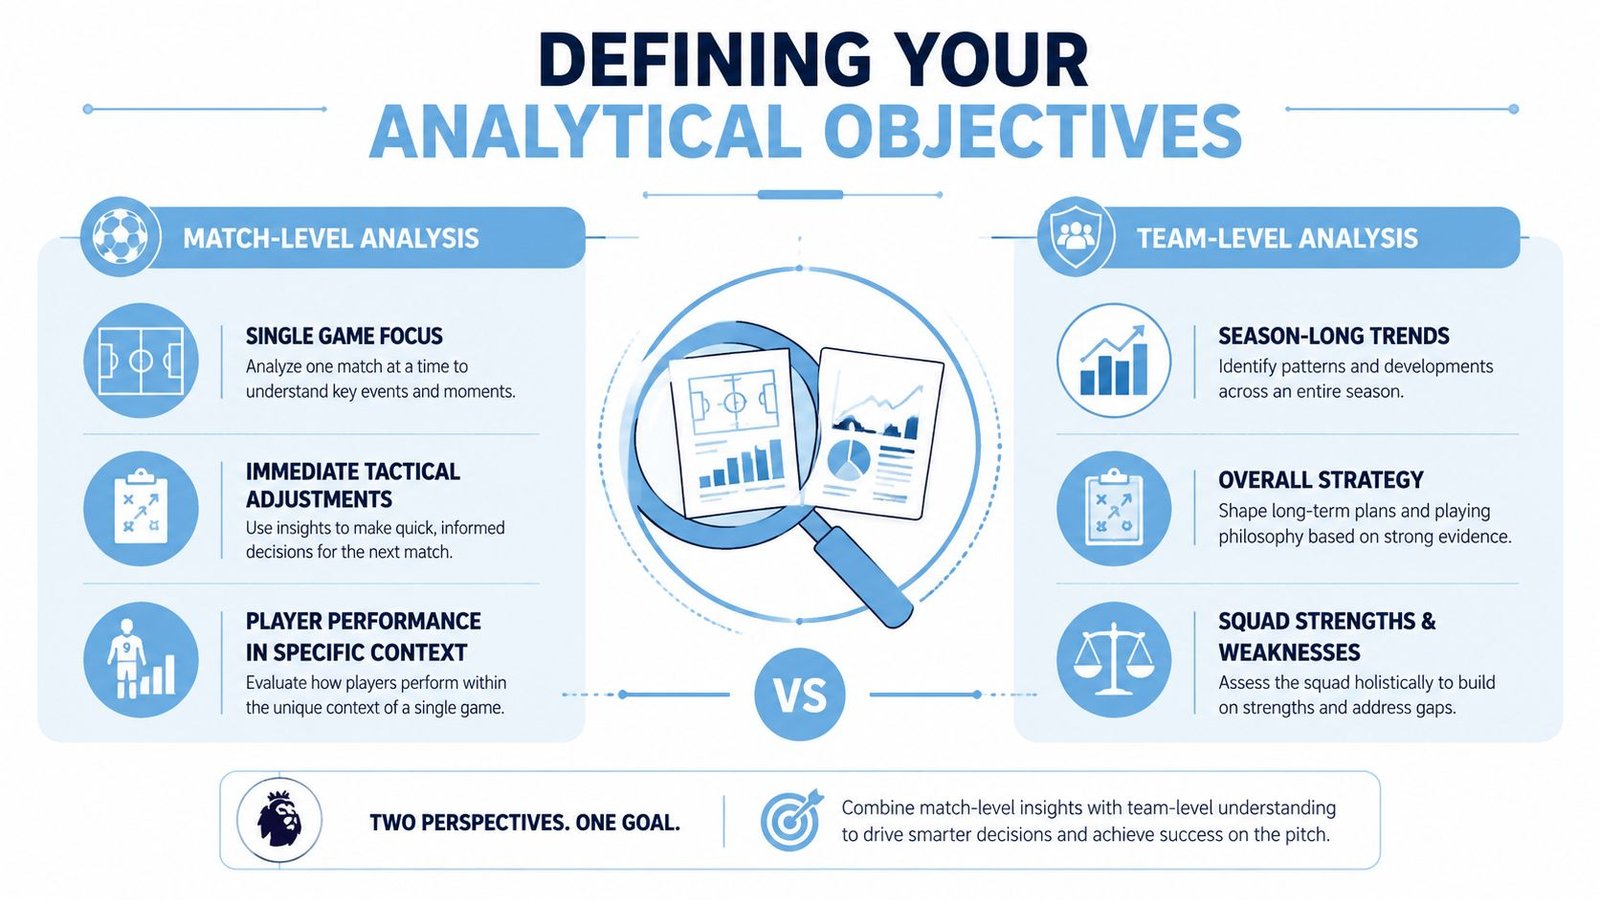
Match analysis asks narrow questions
Match-level work should be tight, opponent-specific, and practical. It usually starts from one of three needs: pre-match preparation, post-match review, or player-role evaluation within a single context.
Typical match questions include:
- Build-up pressure: How did the opponent press the first phase, and which passing lane did they try to remove?
- Defensive exposure: Did the back line lose protection because the midfield jumped too aggressively?
- Role execution: Was the left eight receiving between lines or getting pinned next to the pivot?
- Wide access: Did switches of play create isolation, or did they just move the block sideways?
A useful match report doesn't collect every moment. It filters the game through one priority. Coaches don't need a diary of the full ninety minutes. They need a pattern they can train.
Season analysis looks for persistent behaviour
Season-level premier league team analysis asks a different kind of question. It cares less about one opponent and more about repeatability. The goal is to separate trend from noise.
That matters because early table positions can already reveal more than many people assume. A recent projection after Matchday 10 had Arsenal leading with 25 points, ahead of Manchester City on 19, with Liverpool and Sunderland on 18 each. On that pace, Arsenal projected to 95 points, while Crystal Palace, despite sitting ninth at the time, projected to 67 points, enough for Champions League qualification in that model, with Newcastle, Manchester United, and Chelsea forecast to complete the top six, according to this early-season Premier League projection analysis. The lesson isn't that projections are destiny. It's that points, form, and table context can reveal likely tiers earlier than raw intuition suggests.
Practical rule: Match analysis explains an event. Season analysis tests whether the event belongs to a pattern.
A simple comparison helps:
| Scope | Best question | Main output |
|---|---|---|
| Single match | Why did this game unfold that way? | Tactical corrections and opponent-specific notes |
| Multi-match run | Is this behaviour repeating? | Process trends and sustainability judgement |
| Season level | What is this team, structurally? | Identity, strengths, weak points, squad needs |
The objective decides the rest of the workflow. It determines which clips to tag, which metrics deserve attention, and which observations are worth discarding.
ASSEMBLING YOUR DATA AND ANALYTICAL TOOLS
The best analytical setups aren't always the most expensive. They're the clearest. If the objective is sharp, even a modest workflow can produce useful premier league team analysis. If the objective is vague, better software only creates cleaner confusion.
Start with two data types
Most football analysis relies on two broad inputs. Event data logs discrete actions such as passes, shots, tackles, carries, and pressures. Tracking data follows the continuous positions of players and the ball and gives the spacing context that event data often misses.
For most fans and many early-career analysts, tracking data won't be easily available. That's fine. A lot can still be done with match video, event-based dashboards, and disciplined note-taking. The key is to know what each source can and can't answer.
A practical tool stack often includes:
- FBref: Strong for team and player output summaries, especially when building a broad profile before video review.
- Understat: Useful when the question revolves around shot quality and chance concession patterns.
- WhoScored: Helpful for surface-level event trends and match context before a deeper manual review.
- Wyscout or Hudl: Better suited to tagged video workflows when access exists.
- Spreadsheet tools: Still essential. A clean coding sheet beats a cluttered dashboard.
Use metrics that reveal intent
The mistake new analysts make is chasing volume stats that sound important but don't explain style. Goals and possession tell what happened. They rarely explain how.
The most useful metrics are the ones that point toward tactical intent:
- xG: Best used to judge chance quality, not just finishing.
- PPDA and pressing indicators: Useful for understanding how aggressively a team tries to regain the ball.
- Progressive actions: Carries and passes that move the ball meaningfully toward goal matter far more than sterile circulation.
- Final-third access: Repeated entries tell more about territorial control than a single possession figure.
- Set-piece tagging: Dead-ball work changes matches often enough that it deserves its own file, not a throwaway note.
Modern progression data is a good example of why this matters. In one 2024/25 report, Manchester City recorded 1,495 final-third passes, while Liverpool covered 93,682 metres in progressive ball movement, ahead of City's 87,972 metres, as shown in this Premier League progression data analysis. That tells two different football stories. City's number points to sustained territorial occupation and controlled access. Liverpool's figure points to forceful vertical movement and direct progression.
If two teams both finish with strong possession numbers, progression metrics help identify whether one is controlling territory while the other is simply recycling.
A practical workflow usually works like this:
- Build a baseline file with broad team trends.
- Pull the clips that match the analytical question.
- Tag repeated events such as third-man exits, wide overloads, or failed counter-presses.
- Compare data to film until the numbers and the video are talking about the same thing.
That last step matters most. Metrics should sharpen the eye, not replace it.
ANALYZING TACTICAL SHAPES AND PHASES OF PLAY
Most analytical reports improve immediately when the game is split into phases. Without that split, teams get described as one static shape. That's inaccurate. Premier League sides don't exist in one formation. They morph according to possession, pressure, and field location.
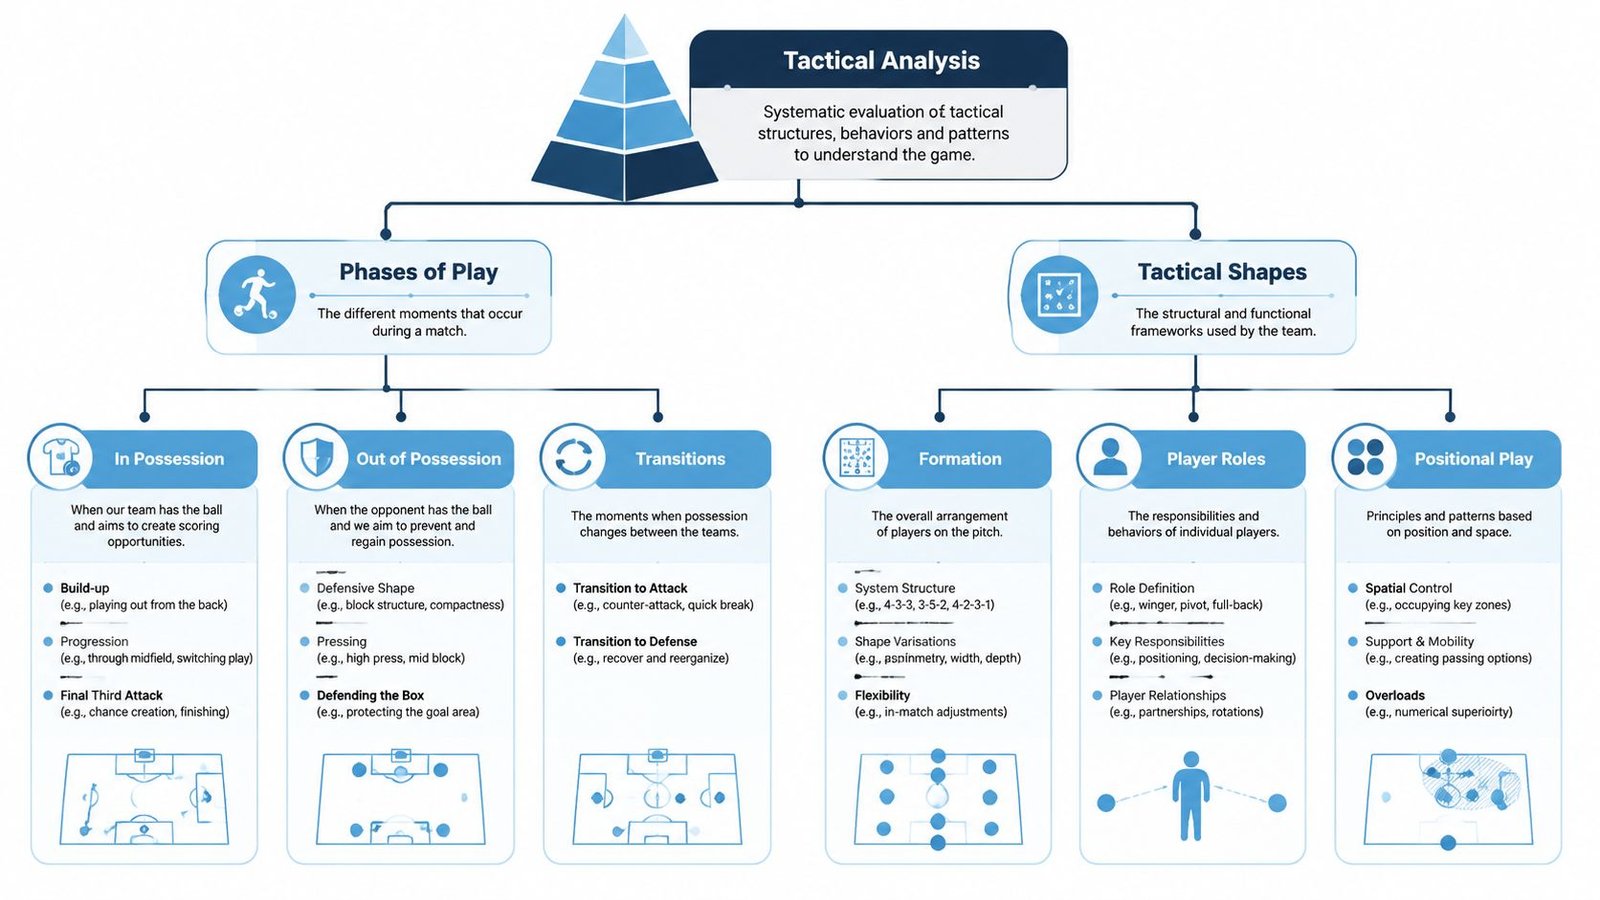
Shape is phase-dependent
A team sheet might list a 4-3-3, but the analytical job starts when that label stops being useful. In possession, the same side may build with three at the back, hold two midfielders underneath the ball, and stretch the last line with five attackers. Out of possession, it may fold into a flatter block. In transition, neither of those shapes fully applies.
That is why shape should always be tied to phase:
- Offensive organisation: How does the team build, progress, and occupy the final third?
- Defensive organisation: Where is the block, what are the pressing triggers, and how is central space protected?
- Offensive transition: What happens in the first seconds after regaining the ball?
- Defensive transition: How quickly does the team counter-press, foul, recover, or retreat?
A lot of analysts struggle here because the work is partly qualitative. Recognising a pattern in body orientation, spacing, or hesitation isn't just a numbers exercise. Anyone trying to sharpen that side of the process would benefit from this guide to analyzing qualitative data, because football video work often depends on coding visual behaviour into categories that stay consistent across matches.
A practical viewing checklist
Video review gets cleaner when each phase has its own checklist. The questions below stop analysis from drifting into general commentary.
For in-possession work, watch for:
- First-line exits: Can the centre-backs and pivot break the first press cleanly?
- Positional rotations: Does the full-back invert, overlap, or hold width?
- Access between lines: Which player receives behind the midfield line, and from where?
- Final-third occupation: Is the box attacked with numbers, or is the team circulating outside it?
For out-of-possession work, the focus changes:
- Pressing trigger: Is the jump based on a backward pass, a poor touch, or a touchline trap?
- Block compactness: Do the lines stay connected?
- Wide protection: Is the winger helping the full-back, or is the full-back isolated?
- Rest-defense shape: Which players stay in position to defend the next ball?
Some of the most important tactical details happen after the ball has already left the zone most viewers are watching.
A short comparison table helps when coding shape changes:
| Phase | What to record | Common mistake |
|---|---|---|
| In possession | Build-up shape, rotations, line-breaking access | Treating the starting formation as the attacking shape |
| Out of possession | Pressing height, compactness, trap locations | Describing effort without identifying triggers |
| Offensive transition | First pass, support angles, runner timing | Counting speed without noting structure |
| Defensive transition | Counter-press shape, recovery lanes, fouling zones | Calling it intensity without showing organisation |
For readers who want a visual reference point on shape language, this explanation of the 4-2-3-1 formation in football is useful because it shows how base structures frame role behaviour before the match starts stretching them.
MASTERING SET-PIECE AND TRANSITION ANALYSIS
Open play analysis gets most of the attention, but matches often swing on moments that sit outside normal flow. Set pieces and transitions deserve their own coding sheet because the questions are different and the margins are tighter.
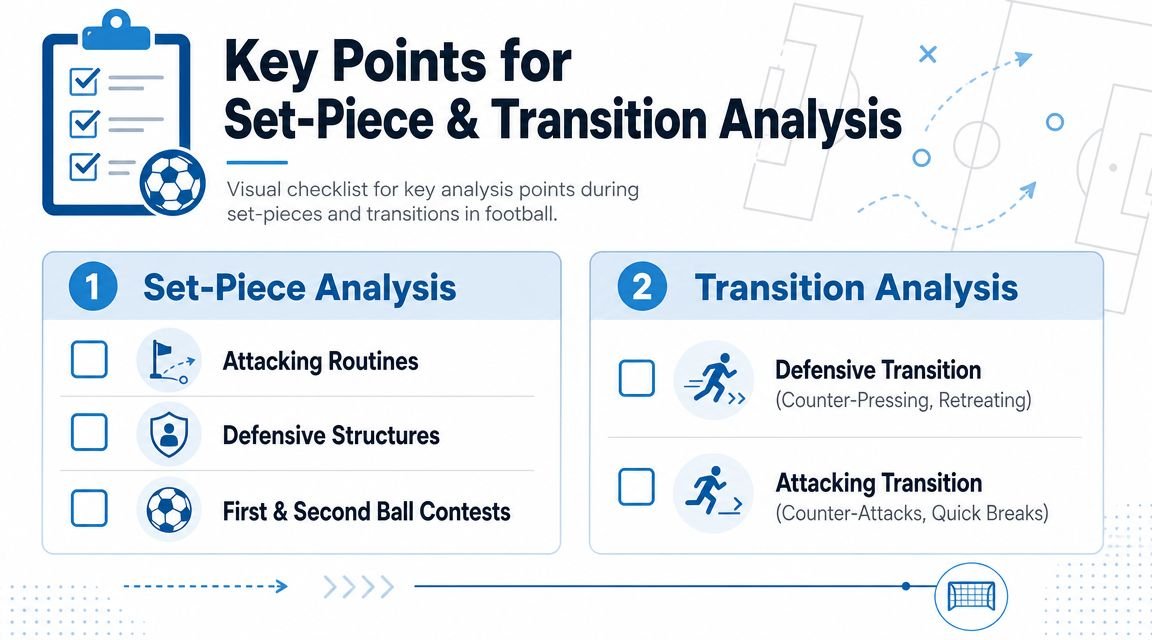
Set pieces need their own coding sheet
Set-piece work should never be reduced to "good delivery" or "poor marking". The analyst needs to identify routine, matchup, screen action, first-contact target, and second-ball coverage.
That level of attention is justified because dead-ball situations can account for up to 30% of goals, and FC Midtjylland famously built 20–25 distinct set-piece routines after studying thousands of corners and free-kicks, with 49% of their goals coming from set pieces in their 2014–15 title-winning season, according to this football analytics overview on set-piece value. The lesson for premier league team analysis is simple. Any team that treats corners and free-kicks as an afterthought is ignoring a major share of match value.
A practical attacking set-piece checklist includes:
- Delivery zone: Near post, central, far post, edge, or short routine.
- Blockers and screens: Who disrupts the primary marker?
- Primary target: Which player is the routine trying to free?
- Second phase: Who attacks the loose ball after the first contact?
Defensive coding should track:
- Marking method: Zonal, man-oriented, or mixed.
- First-contact success: Which zone gets attacked repeatedly?
- Clearance quality: Does the team clear with distance or hand the ball back?
- Edge protection: Is the second ball exposed outside the area?
A more City-specific angle on this can be explored through this look at set pieces and aerial dominance, especially for readers interested in how elite sides create small structural advantages from dead balls.
Transitions reveal structure under stress
Transitions test whether the team's organisation survives chaos. A side can look excellent in settled possession and still break apart the moment the ball turns over.
The key questions are direct:
- After losing the ball, who is close enough to counter-press?
- If the counter-press fails, which players protect central space?
- After regaining it, is the first pass secure or aggressive?
- Do runners move beyond the ball immediately, or does the team reset?
Transition analysis isn't only about speed. It's about whether the team has prepared the pitch position that makes speed possible.
The strongest reports tag both successful and failed transition moments. Analysts learn more from contrast than from isolated clips. One clean counter-press means little unless the same relationships appear again and again.
A WORKED EXAMPLE A TACTICAL ANALYSIS OF MANCHESTER CITY
Manchester City are a good case study because their principles are clear enough to track and demanding enough to expose weak analysis. If the workflow is sloppy, City can look like "a team with lots of possession." If the workflow is sharp, the report starts speaking in terms of occupation, control, progression lanes, and rest-defense.
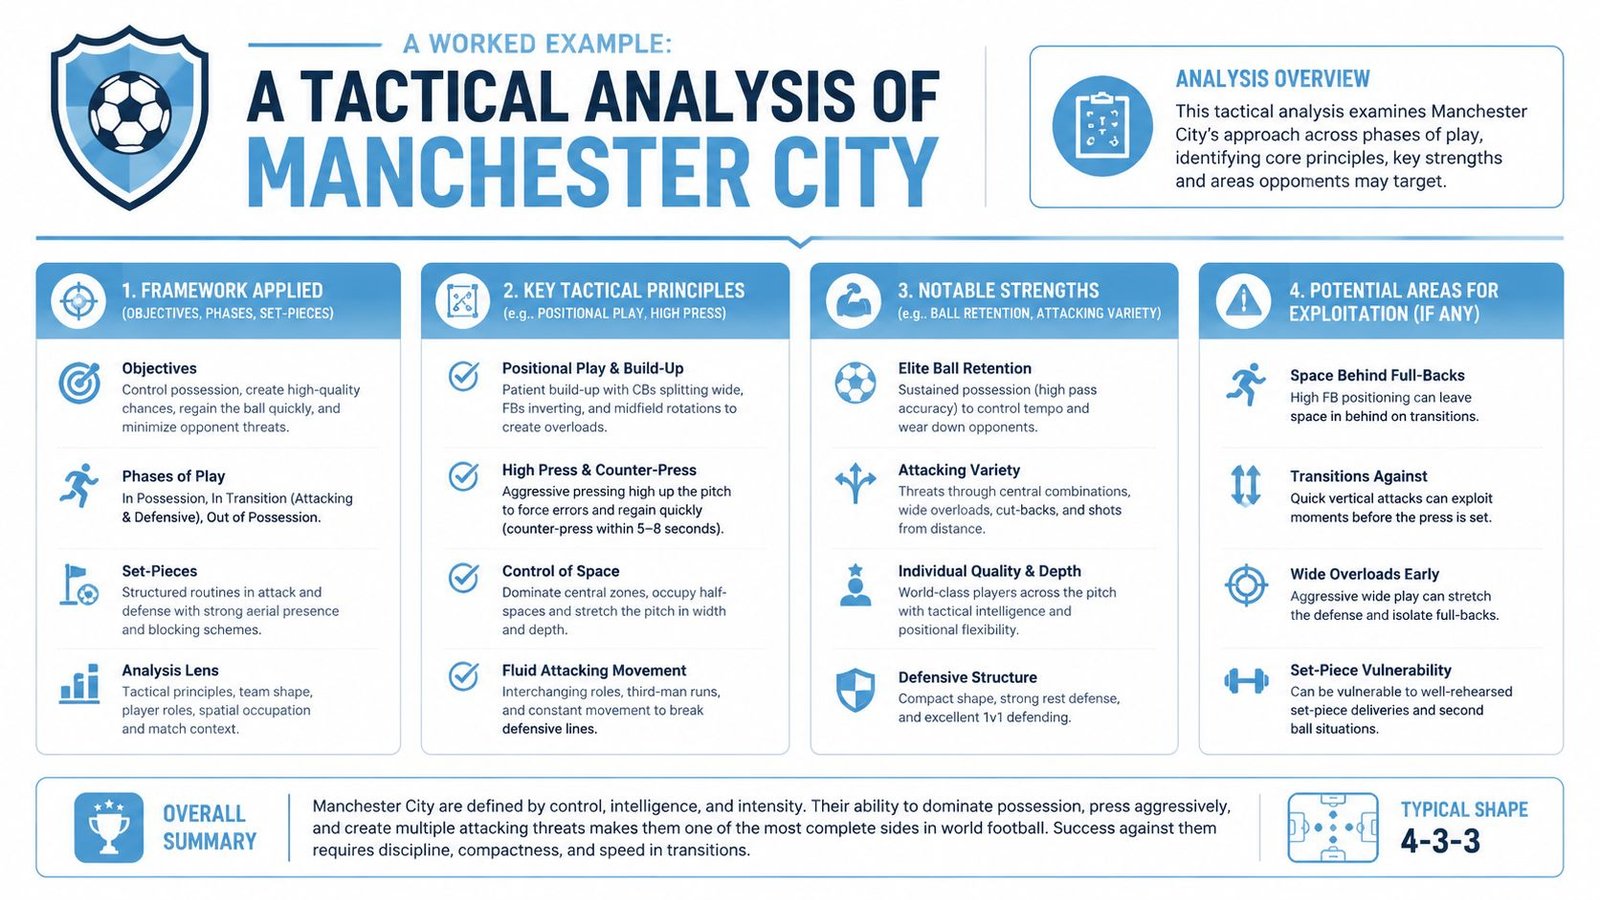
The analytical question
A useful starting question would be: How do Manchester City use their in-possession structure to control matches, and what changes when the key central stabiliser is absent?
That question is narrow enough to guide clip selection and broad enough to produce a full report. It also invites a significant analytical trade-off. City can dominate territory through patient circulation, but the same shape that creates control can become vulnerable if the wrong player vacates the wrong zone.
A video reference helps ground the visual side of the work:
What the data suggests before video review
Before opening the clips, the analyst would mark City as a side associated with elite progression through possession. Their previously cited final-third passing volume already points toward sustained territorial control rather than sporadic attacks. That doesn't prove control on its own, but it gives the first clue about how City try to pin opponents.
The second clue is role dependence. Early 2024/25 analysis noted that when Rodri was absent, City showed reduced midfield control and greater vulnerability during long defensive phases, with Newcastle and Fulham exposing those gaps, as discussed in this analysis of Rodri's structural importance to Manchester City. That matters because team analysis often gets stuck at the collective level. City show why a report must also ask which role is so specialised that the structure shifts without it.
What the video confirms
On video, the first thing to test is the in-possession shape. City often stretch the pitch with width high up, support circulation underneath the ball, and use central positioning to keep pressure on the opposition block. The analyst should tag where the spare man appears. Is it the centre-back carrying out? Is it the pivot receiving cleanly? Is it a half-space player arriving behind midfield?
The second file should focus on defensive transition. Here, City often reveal whether control is genuine. If their rest-defense is well set, losses of possession lead to immediate pressure or controlled recovery. If the central stabiliser is missing, the distances between the ball, the nearest presser, and the covering midfielder can widen. That is where "City looked open" becomes an analytical statement instead of a vague reaction.
A practical City coding sheet might include:
- Build-up access: Which player creates the clean route past the first line?
- Central security: Who holds the space behind the attacking midfield line?
- Wide occupation: Are the wingers pinning the back line or dropping toward the ball?
- Counter-press support: How many players are close enough to squeeze the turnover zone?
- Emergency defending: Which defender steps out, and who covers the vacated lane?
A side as structured as Manchester City should never be analysed only through possession share. The more controlled the team, the more important the detail becomes.
Readers interested in how City alter details from one opponent to another may also find this breakdown of Manchester City's tactical flexibility against West Ham helpful, because flexibility often shows up in role adjustment more than in wholesale formation change.
How the report would read
A finished report should separate observation from judgement. It might conclude that City's attacking structure creates repeated final-third occupation through patient circulation and carefully spaced support around the ball. It might also conclude that the same structure relies heavily on one specialist to preserve central balance during turnovers.
That is the key takeaway. The data points toward control. The video identifies how that control is built. The role analysis explains why the control weakens under certain personnel conditions. At that point, premier league team analysis has done its job. It has moved from "City were worse without Rodri" to a sharper statement about build-up stability, transition protection, and role-specific irreplaceability.
BEYOND THE STATS DEVELOPING YOUR ANALYTICAL EYE
The full workflow is straightforward on paper. Define the objective. Gather the right data. Review the video by phase. Write only the patterns that survive repetition. What separates strong analysts from noisy ones isn't complexity. It's discipline.
That discipline matters most when results and process don't align. Elite analysis treats performance as probability rather than certainty. Liverpool's data team reportedly judged Klopp's downturn at Dortmund as more likely bad luck than a failure of process, a view that influenced their decision to hire him, as described in this overview of data use in the Premier League. That's the mindset worth keeping. A win can hide structural weakness. A loss can contain the better performance.
The analytical eye develops when the viewer stops chasing confirmation and starts testing assumptions. If the team seemed dominant, where was the domination? If the press looked aggressive, what triggered it? If the midfield looked exposed, which relationship broke first?
Results finish the conversation for fans. Process starts the conversation for analysts.
That is why premier league team analysis is both technical and interpretive. Data sharpens the questions. Video gives them shape. Repetition builds judgement. Over time, the match stops looking chaotic and starts looking legible.
Manchester City supporters who want that level of detail on a regular basis should explore Manchester City Analysis, a dedicated platform for tactical breakdowns, role-based assessments, and deeper context around how City's structure evolves across matches and competitions.