The final whistle goes, and the argument starts immediately. One side points to the score, the other to a refereeing call, and almost nobody talks about the two tactical shifts that usually decide the match long before the highlights package is edited.
That's where serious Premier League match analysis separates itself from post-match noise. The score tells what happened. The structure, the pressing, the game state, and the fatigue profile explain why it happened. For readers building a sharper analytical process, the discipline isn't very different from any other evidence-led workflow. SparkPod's guide to productive research is useful for that reason, because good analysis starts with asking better questions, filtering weak assumptions, and grounding conclusions in observable patterns.
Most Premier League matches contain two games at once. There is the public game, made of goals, cards, and talking points. Then there is the tactical game, made of rest defence, access passes, cover shadows, pressing triggers, and the subtle physical drop-offs that change what each team can execute. A side may dominate possession and still lose control of the most dangerous spaces. Another may look passive until the scoreline gives it the exact transition pattern it wanted.
For knowledgeable fans and coaches, that second game is the more revealing one. It shows whether a team's build-up progressed play, whether a press created rushed decisions or empty running, whether a late collapse came from poor structure or tired legs, and whether the opening goal changed the geometry of the match. Proper Premier League match analysis doesn't stop at who had the ball. It tracks how teams used space, how they adapted to pressure, and how the match changed once the original plan collided with the scoreboard.
Table of Contents
- INTRODUCTION
- UNDERSTANDING THE TACTICAL FRAMEWORK
- ANALYZING THE KEY PHASES OF PLAY
- DECODING PRESSING AND TRANSITION PATTERNS
- USING STATS FOR DEEPER MATCH ANALYSIS
- HOW GAME STATE AND FATIGUE SHAPE THE MATCH
- CONCLUSION TURNING ANALYSIS INTO INSIGHT
INTRODUCTION
A good analyst rarely starts with the goal. The better starting point is the pattern that made the goal likely.
Consider a common Premier League scenario. A team controls the opening phase with calm circulation across the back line, pins the opposition fullback, and wins territory through repeated entries into the half-space. Then it concedes first from a transition. The public verdict says the better side was punished. The stronger tactical reading asks a harder question. Was that control unstable from the start because the rest defence behind the ball was too loose, the counterpress arrived a second late, or the midfield line got stretched by repeated high positioning?
That difference matters because football isn't a ledger of isolated events. It's a sequence of connected structures. A side that records a high share of possession may still fail to generate clean access into the box. A team that appears to defend deep may be baiting the first pass, waiting for a wide trap, then attacking the exposed channel after the regain. Premier League match analysis becomes useful only when it explains those relationships.
Practical rule: Start with repeatable mechanisms, not standout moments. Goals often confirm a pattern that was already forming.
The league rewards analysts who can separate process from outcome. One open historical archive of English Premier League matches runs from the 1993-94 season onward, covers 32 season files, and includes more than 20 variables per match, including goals, shots, shots on target, fouls, cards, and corners, which makes long-range tactical comparison possible instead of relying only on recent form (data-rich Premier League archive). That long view matters because tactical ideas repeat in updated forms. The language changes. The spatial logic often doesn't.
FORMATIONS ARE REFERENCE POINTS
The listed formation on a team sheet is only the starting picture. The actual structure appears when the ball moves.
A nominal 4-3-3 can become a 3-2-5 in possession, with one fullback stepping into midfield and the far-side winger holding width to pin the back line. Out of possession, that same side may collapse into a 4-1-4-1 to protect central access and force circulation wide. Coaches don't use formations as fixed labels. They use them as mechanisms for controlling space, securing rest defence, and creating the right distances between players in each phase.
The cleanest way to read a structure is to freeze two moments. First, look at kick-off or a defensive set-piece. That usually reveals the team's base shape. Second, observe the first stable possession sequence and the first settled defensive block. Those moments reveal the manager's real intentions.
A useful comparison is a chess opening. The first arrangement doesn't win the match by itself, but it declares priorities. Does the side want central overloads, wing isolation, or deeper protection against transitions? A structure answers those questions before any shot is taken.
For readers wanting a concrete reference for how one common shape behaves in modern football, this breakdown of the 4-2-3-1 structure in practice is a helpful companion.
WHAT TO TRACK WHEN THE SHAPE CHANGES
Three things matter more than the raw numbers in the formation.
- Compactness: The vertical and horizontal distances between lines determine whether a team can counterpress, protect second balls, and close central passing lanes.
- Width: Wide occupation can stretch a back four, but only if the ball-near triangle can find the winger early enough.
- Overloads: A spare player is only useful if the team can access him. Many sides create a midfield overload on paper and still fail to exploit it because the passing lane is screened.
A formation is best read as a set of distances and responsibilities, not a row of numbers.
The strongest analysts watch role changes rather than shirt numbers. A fullback may become the spare midfielder. A winger may become the pressing trigger. A striker may stop acting like a finisher and start acting like a wall pass to release runners beyond him. Once those role swaps become visible, the match starts to make tactical sense.
UNDERSTANDING THE TACTICAL FRAMEWORK
By the tenth minute, the nominal shape from the teamsheet is usually gone. One fullback is stepping into midfield, the far winger is holding the width alone, and the striker has started dropping to pull a centre-back out of line. If the analyst keeps reading the match as a static formation, the actual contest is missed.
What matters here is the mechanism each coach has built for the game's changing conditions. A team protecting a lead rarely keeps the same spacing it used at 0-0. A side chasing the match often commits one more player ahead of the ball, which changes both its attacking numbers and its exposure after turnovers. Fatigue sharpens those trade-offs. Distances grow, recovery runs slow, and a structure that looked stable in the first half can become too expensive to maintain in the last twenty minutes.
The tactical framework is best read through repeated patterns, not lineup graphics. Watch how the centre-backs receive the first pass under pressure. Check whether the pivot stays available on the same line or moves higher to pin midfielders. Track the far-side fullback when the ball is wide. His position often tells you how much counterattack risk the coach is willing to accept.
Three questions usually separate a clear structure from a vague one.
- Where is the spare player in build-up? Some sides create him with the goalkeeper, others by inverting a fullback, others by dropping a midfielder into the back line.
- Who occupies the last line? If nobody fixes the opposition back four, possession in front of the block becomes sterile and easy to defend.
- How many players stay behind the ball with purpose? Rest defence is not just numbers. It is the spacing that lets a team deal with the first clearance, second ball, and immediate counter.
Those details become more revealing once game-state changes. A team that leads may stop asking its fullbacks to arrive high and wide, not because the original plan failed, but because protecting central transition spaces now carries more value than sustaining five-lane occupation. A trailing team often does the opposite. It pushes a centre-back wider in possession, releases both fullbacks, and accepts longer defensive recoveries in exchange for more bodies around the box. The shape has changed, but the deeper point is why it changed.
Role allocation matters more than the formation label. A 4-2-3-1 with different positional responsibilities can behave like a possession structure in one phase and a pressing structure in the next. The analyst's job is to identify which player secures circulation, which player pins the last line, and which player protects the space behind the attack.
Good framework analysis also explains late-match disorder. If the wingers stop recovering with the same speed, the block can no longer stay compact. If the single pivot is asked to cover both half-spaces after an aggressive substitution, passing lanes open either side of him. Coaches do not only lose control because the opponent improves. They also lose it because the physical cost of their own structure rises as the match wears on.
That is why tactical framework work has to be dynamic. The starting map matters. The more useful read is how that map bends under pressure, scoreline, and fatigue.
ANALYZING THE KEY PHASES OF PLAY
Matches become clearer when they are broken into phases instead of treated as one uninterrupted flow. The same team can look secure in build-up, blunt in settled attack, and vulnerable the moment possession turns over. Without separating those moments, the analysis becomes too broad to explain anything.
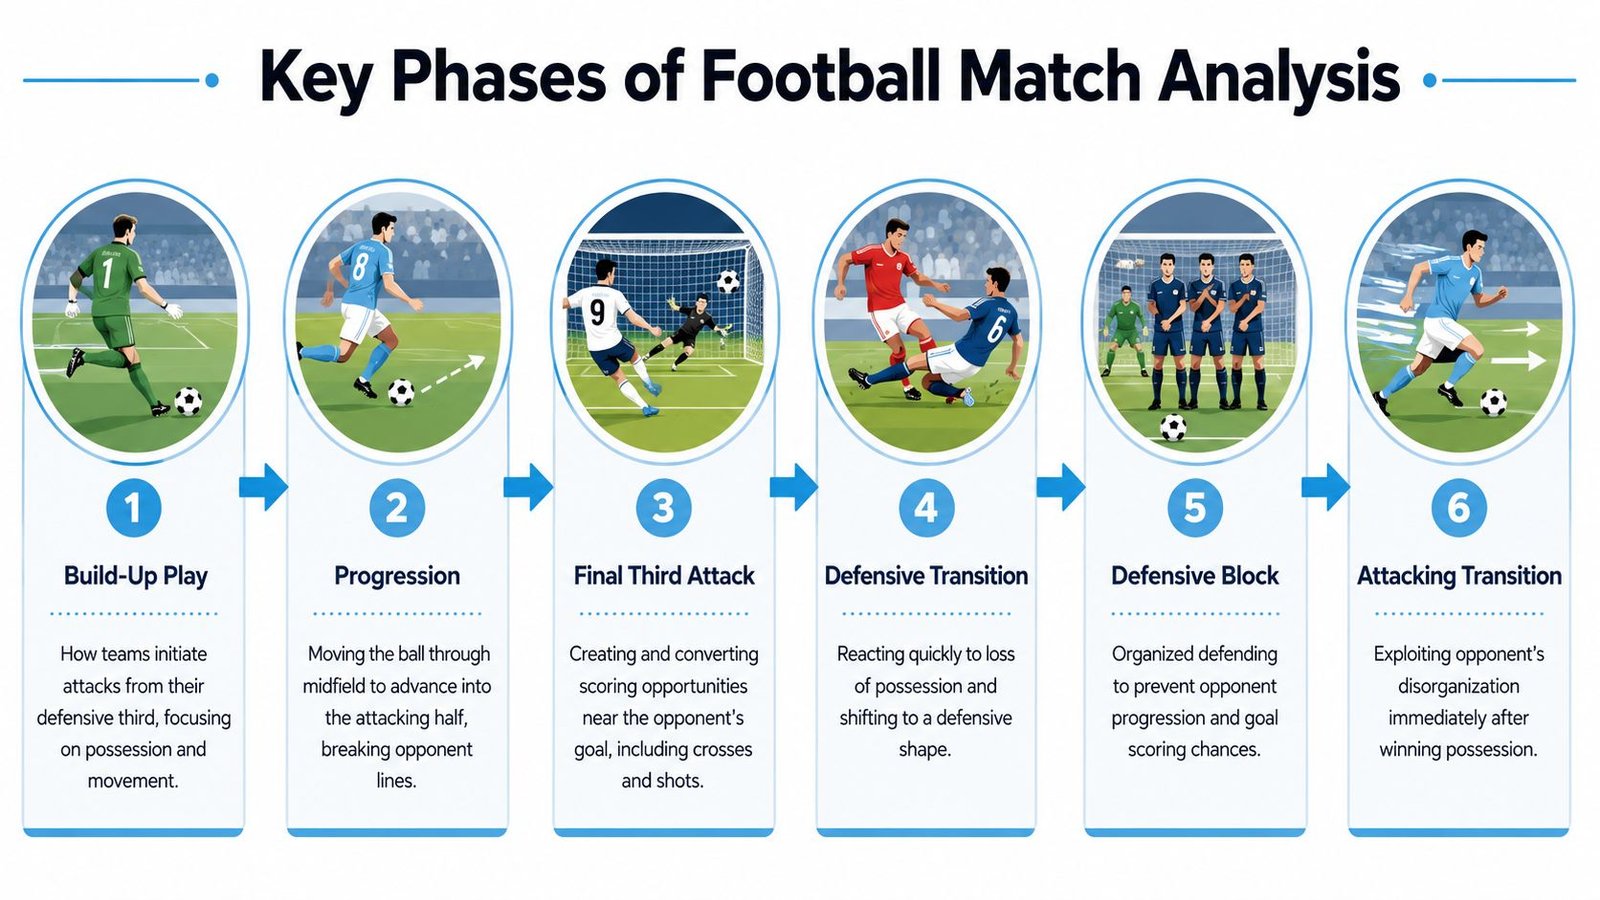
The most useful working model has three major chapters. Build-up and progression. Final-third attack. Defensive phase, including the moments after losing the ball.
BUILD-UP AND PROGRESSION
The opening question is simple. How does the team move the ball from its defensive line into advanced territory?
That answer usually sits in one of three patterns. Some sides play through the press with short distances, third-man combinations, and a goalkeeper comfortable acting as an extra outfielder. Others attract pressure before releasing into the fullback or the winger. Others still go direct early, not because they lack control but because they want second-ball chaos in midfield.
Manchester City offer a useful model for reading build-up. When a fullback inverts, the team often creates a central box around the first line of pressure. That gives the centre-backs shorter vertical options and helps secure the counterpress after progression. The point isn't the inversion itself. The point is what it changes. It improves central access, stabilises the rest defence, and gives the wide player a higher starting position.
When analysing this phase, the checklist is practical:
- First-line superiority: Does the team create a spare man against the press?
- Line-breaking access: Are midfielders receiving on the half-turn or only with their back to goal?
- Width timing: Does the wide player stay high enough to stretch the block before the ball arrives?
A useful match lens for this phase is the hidden value of dead-ball situations and territorial pressure. This related piece on set-piece importance and aerial dominance adds another layer, because build-up quality often shows up later through the corners and second-phase situations a team generates.
A short visual breakdown can help anchor those observations before the analyst returns to the live match.
FINAL THIRD PATTERNS
A team can progress well and still attack poorly. That usually happens when possession reaches the final third without clear relationships around the box.
Recent Premier League data analysis shows that teams combining high progressive distance with strong pass completion, specifically Manchester City, Arsenal, and Liverpool, tend to sustain attacking pressure and territorial dominance. The same analysis reports Liverpool's 120 switches and 1,427 final-third entries, indicators of a direct and flexible attacking model that can bypass compact blocks and accelerate play into dangerous zones (vertical progression and chance creation analysis).
Those figures matter because they separate sterile circulation from meaningful pressure. A side can dominate the ball and still fail to move the defensive block. Frequent switches of play, repeated final-third entries, and clean occupation of the far-side lane usually signal that the attack is forcing defensive decisions rather than merely recycling.
Key signs in this phase include:
- Box occupation: Is there presence across the penalty spot, near-post lane, and far-post lane?
- Combination zones: Are the half-spaces producing cut-backs, wall passes, and underlaps?
- Recycling speed: After a blocked cross or clearance, does the attacking side keep the opponent pinned?
DEFENSIVE PHASE AND REST DEFENCE
Many post-match readings underrate what happens when a team attacks without the ball. Rest defence is the structure left behind to deal with the next turnover.
A side with five attackers ahead of the ball may still be secure if the covering positions are intelligent. The central defenders hold balanced distances, the pivot screens the first vertical pass, and the fullback on the weak side tucks in early. But if the spacing stretches, the opponent only needs one clean regain to attack an exposed channel.
The defensive phase begins before possession is lost. It starts with where the covering players stand while their team still has the ball.
That's why the best phase-based analysis doesn't ask only whether a team created chances. It asks what those attacking choices cost in transition protection.
DECODING PRESSING AND TRANSITION PATTERNS
Pressing gets described too often as energy. In reality, it's an information problem. The pressing side tries to shape the opponent's next pass before the ball is played.
A coordinated press works because the distances, body angles, and cover positions all point toward the same trap. The first runner rarely aims only to win the ball. More often, that player blocks the central exit and funnels play toward a zone where the next defender can jump. That's why a team can appear to “run hard” and still press badly. If the second and third movements don't support the first one, the opponent plays around the pressure.
PRESSING IS ABOUT ANGLES NOT EFFORT ALONE
The first thing to watch is the trigger.
A backwards pass, a poor first touch, a pass toward the touchline, or a centre-back receiving on the weaker foot can all trigger an aggressive jump. The best presses are selective. They don't attack every pass. They wait for the pass that narrows the opponent's options.
The second thing is the cover shadow. A forward may press the centre-back from an angle that seems indirect, but the objective is to block the lane into the pivot while forcing play outside. Once the ball travels wide, the fullback becomes the trap point. The winger jumps, the fullback locks on behind, and the near-side midfielder protects the inside return.
One practical benchmark helps support those visual reads. Premier League match analysis is strongest when it combines process metrics like xG and PPDA with tactical context. In 2023/24, Liverpool's 8.3 PPDA is cited as evidence of a highly aggressive press, while Burnley's 15.2 PPDA reflected a deeper, more passive block. The practical implication is that lower PPDA often means more frequent turnovers and more immediate high-quality attacking situations after regains (PPDA and tactical context in Premier League analysis).
TRANSITION MOMENTS REVEAL TEAM IDENTITY
The instant possession changes hands, the match tells the truth about a team's structure.
Some sides counterpress immediately with short, violent jumps around the ball. Others retreat to protect central space and delay the counter. Both methods can work. The real test is whether the team's distances support the decision. If the front line presses but the midfield line doesn't step with it, the first press is broken too easily. If the whole team drops but the back line doesn't compress the space, the opponent can still run through the middle.
A sharp transition analysis usually focuses on three questions:
- Where was the ball lost? Central losses are more dangerous because the opponent can attack either side.
- How many players were ahead of the ball? Numbers alone don't settle it, but they shape the recovery task.
- Was the first defensive action delaying or winning? Sometimes the best transition defender doesn't tackle. He slows the attack and lets the block recover.
A good counterpress isn't just about regaining possession. It's about preventing the first forward-facing pass after the turnover.
This is often where matches swing. A side may look fluid in settled possession, then concede because its attacking spacing leaves no immediate access to the ball carrier after the loss. Another may generate little in long possessions but repeatedly create dangerous moments from recoveries in the attacking third. That isn't randomness. That's structure showing itself in the fastest phase of the match.
USING STATS FOR DEEPER MATCH ANALYSIS
The eye test remains essential, but it becomes stronger when numbers confirm what the tactical picture suggests. Data shouldn't replace the match. It should sharpen the reading of it.
The best statistics in Premier League match analysis describe process. They help explain whether a team created good chances, restricted the opponent's access, or forced the match into the zones it wanted. A possession total alone can't do that. Neither can shot count without context.
WHEN DATA SUPPORTS THE EYE TEST
A central modern shift in analysis is the move away from judging matches by goals alone. One study of Premier League data examined xG, xGA, PPDA, and OPPDA, and reported that Defensive Challenges (DC) and Offensive Defensive Challenges (ODC) were statistically significant, supporting the view that defensive and pressing actions can explain match outcomes beyond the final score (Premier League metrics study on xG and pressing indicators).
That finding matters because it validates a common coaching intuition. A team can lose while doing several things well. It can create better chances than the opponent, defend the box competently, and still get punished by a small number of decisive moments. Equally, a winning team may have finished efficiently while allowing too many clean entries or failing to protect second balls. Data helps separate durable performance from one-off finishing swings.
A practical example comes from creative value. The same broader trend in modern analysis uses metrics like xA and xAG to identify whether possession is becoming assisted-shot value or remaining harmless circulation. That distinction is vital when analysing teams that dominate territory.
For readers who want to see how statistical reads can frame a specific match-up, this data-led preview of Manchester City against Leeds with xGA, counter-attacks, and defensive duel context offers a useful applied example.
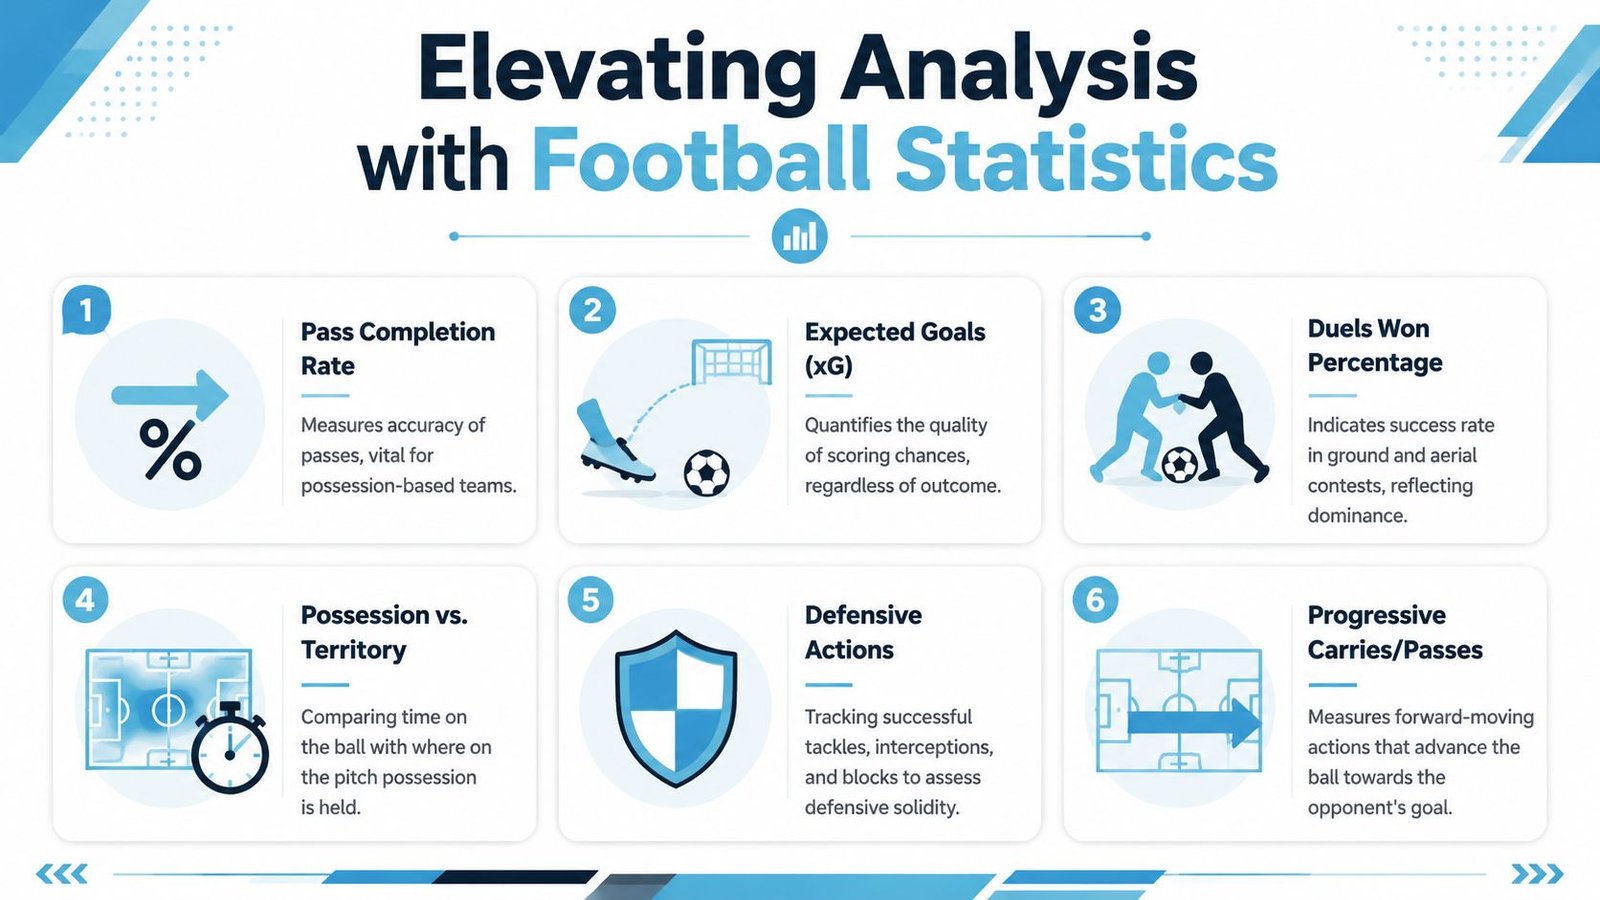
KEY ANALYTICAL METRICS DEFINED
| Metric | What It Measures | Why It Matters |
|---|---|---|
| xG | The quality of chances created and conceded | It separates shot volume from chance quality |
| xA | The value of passes that lead to shots | It shows whether creators are producing dangerous service |
| PPDA | Passes allowed per defensive action | It helps estimate pressing intensity and defensive height |
| xGA | The quality of chances allowed | It tests whether a side's defending is actually suppressing danger |
| DC | Defensive challenge activity | It adds evidence on how teams disrupt attacks |
| ODC | Offensive defensive challenge activity | It helps capture aggressive ball-winning higher up the pitch |
A smart analyst never lets one metric dominate the verdict.
- Use xG with video: A high total built from low-pressure shots tells a different story than a lower total built from repeated central cut-backs.
- Read PPDA with field position: A low PPDA means more when the press is forcing play into bad zones.
- Check creative metrics against territory: A team may enter advanced areas often but still fail to generate high-value service.
Numbers become useful when they answer a tactical question the match has already posed.
That's the point. Stats don't make analysis colder. They make it harder to hide behind convenient narratives.
HOW GAME STATE AND FATIGUE SHAPE THE MATCH
The most misleading habit in match review is treating a tactical plan as if it stayed fixed for the full ninety minutes. It rarely does. The scoreboard changes risk appetite, spacing, pressing height, and even the type of pass players are willing to attempt.
THE SCORELINE REWRITES THE MATCH
Most public discussion still leans too heavily on pre-match numbers. But fewer pieces of Premier League match analysis explain how the contest changes once one side leads or trails. That gap matters because context-sensitive outcomes are often decisive. A stronger reading asks how build-up changes when chasing the game and how opponents respond to scoreline pressure after scoring first (game-state context in Premier League analysis).
A leading team often shortens the match. Not necessarily by defending deep from the next kick-off, but by changing where it accepts risk. Fullbacks may stop advancing together. The far-side winger may stay narrower to support the second ball. The press may become more selective, with the front line screening central access rather than jumping at every trigger.
The trailing side usually does the opposite. It pushes more players ahead of the ball, accepts larger spaces in rest defence, and circulates faster in search of earlier entries. That can improve attacking volume while making transitions more dangerous the other way.
FATIGUE CHANGES WHAT A TEAM CAN REPEAT
Fatigue doesn't just reduce speed. It alters execution.
A press that looked synchronized in the first half may break apart late because the first runner arrives but the midfield line can't close the supporting lane quickly enough. Wide players stop recovering to fullback depth. Distances between the lines stretch by just enough to open the central pocket. Simple actions become a fraction slower, and at Premier League level that fraction is often the whole advantage.
The useful analytical question is not whether players looked tired. It is which actions became harder to repeat:
- Counterpressing after loss
- Recovering weak-side width
- Tracking third-man runs
- Winning second balls from clearances
Late-match tactical decline is often physical decline expressed through spacing.
That's why game state and fatigue should sit inside every serious post-match review. A side may not have “lost concentration” in any vague sense. It may have reached the point where its original intensity, spacing, and coverage could no longer be reproduced.
CONCLUSION TURNING ANALYSIS INTO INSIGHT
The strongest Premier League match analysis doesn't chase every event equally. It identifies the structures that shaped the event.
That means reading formations as living systems rather than static labels. It means separating build-up, final-third attack, and defensive control into distinct phases. It means understanding pressing as a coordinated manipulation of passing options, not a sprinting contest. It means using xG, xA, PPDA, DC, and ODC to test what the match seemed to show. And it means refusing to treat the game as static once the opening goal changes incentives and fatigue starts rewriting what players can still execute.
For coaches and informed supporters, that approach produces better answers to the questions that matter. Why did one team dominate territory without creating enough? Why did another side improve once it went behind? Why did the press disappear late? Why did a harmless possession game suddenly turn into a transition battle?
Those answers sit in the interaction between structure, context, and execution. The score remains important, but it's only the final layer of the story. The deeper layer is tactical cause. Once that becomes visible, match review stops being recap and becomes diagnosis.
That's the difference between remembering the result and understanding the match.
Manchester City supporters who want that level of detail every week can find more tactical breakdowns, match reviews, and data-informed opinion at Manchester City Analysis, where the focus stays on explaining how City's structure, pressing, and in-game adjustments shape results.