A scout once wrote that a midfielder “looked lively, covered ground, and wanted the ball.” A modern report on the same player would still include that judgement, but it would also ask sharper questions: where did the player receive, what actions moved the opponent, and did those actions improve the team's chance of scoring or suppress the chance of conceding?
That change matters because football is full of misleading surfaces. A team can dominate possession and still create very little. Another can concede a long run of harmless shots and look stable until one match exposes the fragility. Analytics in football helps coaches separate noise from repeatable patterns, then connect those patterns to training design, selection, and match strategy.
Table of Contents
- INTRODUCTION
- BEYOND THE BOX SCORE WHAT ARE FOOTBALL ANALYTICS
- THE MODERN ANALYSTS TOOLKIT KEY METRICS EXPLAINED
- FROM DATA TO DECISIONS THE ANALYST WORKFLOW
- CASE STUDY MANCHESTER CITYS ANALYTICAL DOMINANCE
- CONCLUSION ACTIONABLE INSIGHTS FOR EVERYONE
INTRODUCTION
Football used to tolerate broad descriptions because information was scarce. If a winger looked dangerous, that often passed as analysis. If a side had more shots, possession, and territory, the assumption was that it had controlled the match. That language still exists, but at elite level it isn't enough on its own.
The reason is simple. Coaches don't just need to know what happened. They need to know why it happened, whether it's repeatable, and what decision should follow. That is the value of analytics in football. It turns a pile of match events into a decision framework.
Manchester City is a useful case study because the club's style makes the gap between raw stats and real insight very clear. A City match can look straightforward from the outside: long spells of possession, aggressive pressing, structured positional play. But that surface view misses the machinery underneath. Coaches and analysts need to know which possessions destabilised the opponent, which pressing actions created recoveries, and whether the team's spacing supported the intended tactical plan.
Football analytics is most useful when it changes a coaching decision. If it doesn't alter selection, training, pressing cues, or match planning, it's just a cleaner spreadsheet.
That is also why simplistic arguments about “stats versus the eye test” miss the point. Good analysts still watch the game closely. Good coaches still trust what they see. The difference is that modern workflows test those impressions against evidence.
At elite level, performance analysis now tracks player movements, strategic patterns, and match events such as goals, assists, tackles, interceptions, fouls, and set pieces. Combined with metrics like Expected Goals (xG) and Defense-adjusted Value Over Average (DVOA), that broader view helps staff identify whether a side is building attacks in a balanced way or relying on a more direct, counter-attacking profile, as explained in this overview of modern football analytics.
BEYOND THE BOX SCORE WHAT ARE FOOTBALL ANALYTICS
FROM COUNTING TO EXPLAINING
Traditional stats describe symptoms. Analytics tries to diagnose the condition.
A doctor doesn't stop at “the patient has a fever.” The useful question is what caused it, how severe it is, and what intervention will work. Football is similar. Possession share, shots, and pass completion tell part of the story, but they rarely explain whether a team controlled the match in a meaningful way.
A side can complete many safe passes in harmless areas. It can take a high number of low-quality shots. It can even post decent attacking totals while repeatedly exposing itself in defensive transition. That's why analytics in football moved beyond simple counting and toward contextualised metrics that judge action quality, field location, pressure, and game state.
The practical shift is from description to explanation:
| Type | What it says | What it misses |
|---|---|---|
| Raw data | “Team A had more shots” | Shot quality, shot context, defensive cost |
| Metric | “Team A produced better chances” | Why those chances appeared |
| Actionable insight | “The opponent lost central compactness when their full-back jumped early” | Nothing, if tied to training and match planning |
Data begins to gain importance for a coach at this stage. It identifies the repeatable pattern beneath the visible event.
WHAT COACHES ACTUALLY NEED
A coach rarely needs more volume. A coach needs better filtering.
Useful analytics answers questions like these:
- Chance creation: Are attacks producing shots from dangerous zones or just inflating totals?
- Rest defence: Is the team structurally secure when possession breaks down?
- Pressing design: Are pressure actions coordinated, or are players pressing alone?
- Role clarity: Is a midfielder helping circulation, progression, control, or all three?
Practical rule: Never lead with a dashboard. Lead with the football problem, then pull the relevant metric.
That is why advanced metrics matter more than broad match summaries. They connect events to tactical intention. A balanced attack might show up as strong possession, accurate passing, and frequent shots on target. A counter-attacking side may show a different profile entirely, with lower possession but strong shot efficiency. Analytics helps staff recognise which game model is being expressed on the pitch, not just what the scoreline suggests.
The strongest analysts also know what doesn't work. Dumping a large report on a coach the day before a match doesn't help. Neither does chasing novelty metrics that sound clever but don't inform player tasks. The best work is usually compact, role-specific, and tied to moments the squad can train.
THE MODERN ANALYSTS TOOLKIT KEY METRICS EXPLAINED
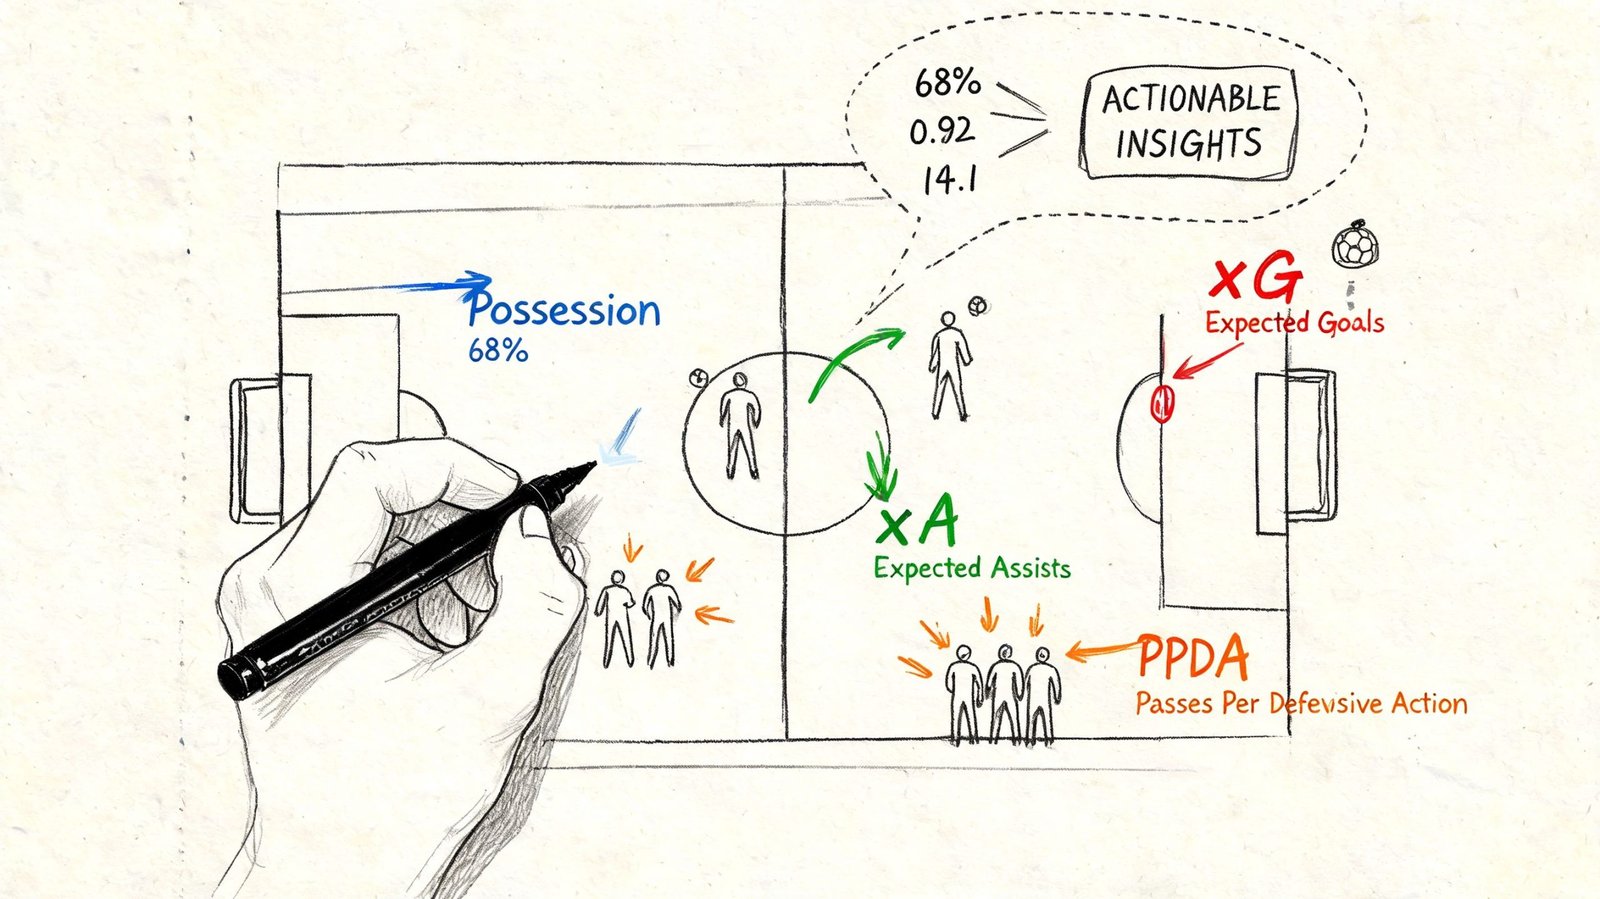
EXPECTED GOALS AND EXPECTED ASSISTS
The most useful football metrics are the ones that stay close to tactical reality. They don't replace video. They make video review more precise.
Expected Goals xG estimates the probability that a shot becomes a goal based on factors like location and context.
A simple match example helps. If a striker receives a cutback near the centre of the box with defenders scrambling, that chance will usually rate more highly than a speculative effort from distance. The coach's question isn't just whether the team shot often. It is whether the structure created the right kind of shots.
Expected Assists xA estimates the probability that a pass leads to a goal.
Understanding chance creation requires looking beyond the player who eventually scores. A winger who consistently provides cutbacks, finds runners in behind, or delivers disguised passes through a compact defense generates significant value even when a goal does not result. xA helps separate the creative process from the finishing outcome.
For coaches, these two metrics answer different problems:
- xG helps judge shot quality and whether chance creation is sustainable.
- xA helps identify who is generating danger before the shot.
- Together they reveal whether an attack relies on individual finishing or a repeatable creation structure.
PRESSING METRICS AND TACTICAL PRESSURE
PPDA is often used as a shorthand for pressing intensity. It estimates how many passes a team allows before making a defensive action. Lower values generally suggest more active pressure. It can be useful, but it's also blunt. It won't tell a coach whether the press was well-timed, compact, or directed into the right zones.
That is where tracking data becomes far more useful.
At elite clubs such as Manchester City, analysts use advanced tracking data and physical performance feeds to quantify High Intensity Press Events, defined as moments when a player closes the distance to an opponent in possession within 1–2 seconds while below ball-pressure thresholds. In Premier League benchmark data, City's midfield units average 8–12 such events per 90 minutes in build-up phases, and coaches use these patterns because compact pressing in the opponent's half, with 20–25 m between defence and midfield, reduces conceded xG by roughly 0.3 per game, according to this technical glossary on key football data points.
That metric changes coaching language. Instead of saying “press harder,” staff can say:
- Jump on the backward pass
- Protect central lanes while the front player curves the run
- Hold line compactness so the second ball is playable
A tactical discussion of shapes also matters here, because pressing and build-up responsibilities change with structure. A 4-2-3-1 shape in modern football gives different pressing cover and central access points than a back-three or box midfield setup.
To visualise how analysts present these ideas in simpler educational terms, this breakdown helps:
PACKING AND LINE BREAKING CONTEXT
Packing tracks how many opposition players are bypassed by a pass or dribble.
It sounds abstract until it is tied to a scene. A centre-back passes square and keeps possession. Useful, but not disruptive. Then a holding midfielder receives on the half-turn and punches a pass through the first two lines into an advanced midfielder between the lines. That single pass may remove several defenders from the immediate phase. Packing tries to capture that value.
It can help with three coaching questions:
- Which players break lines rather than just recycle the ball?
- Which passing lanes produce progression without losing structure?
- When does vertical ambition become reckless?
Metrics can mislead if used carelessly. A high packing action isn't always good if it leaves the team exposed after loss. A safer circulation sequence isn't always passive if it manipulates the opponent and opens the next pass. Metrics need tactical context, or they become trivia.
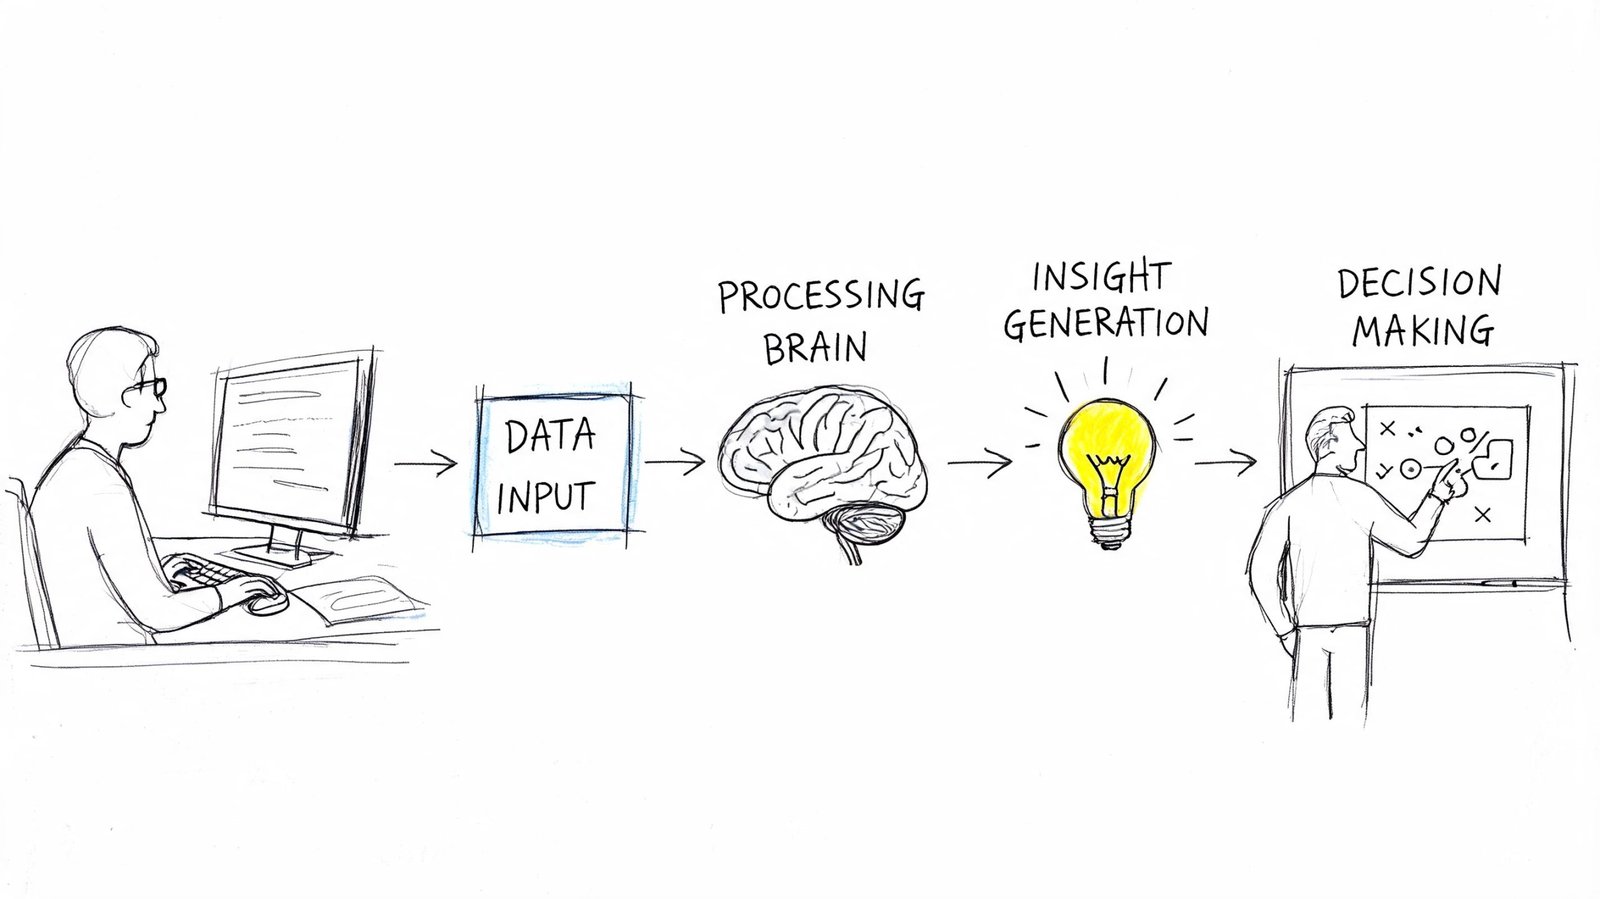
FROM DATA TO DECISIONS THE ANALYST WORKFLOW
The core work of analytics in football happens before and after the dashboard. Most of the job is filtering, prioritising, and translating. Elite environments don't suffer from lack of data. They suffer from too much of it.
A single match can generate an enormous event and tracking record. The problem isn't access. The problem is choosing what deserves attention. That challenge appears outside football too. In a separate sports context, a discussion of analytics adoption noted the gap between having advanced capability and embedding it into strategy, including the difficulty of turning 1.4 million data points from a single match into prioritised decisions under pressure, as discussed in ESPN's piece on analytics adoption and execution gaps.
OPPOSITION SCOUTING
Scouting starts with opponent tendencies, not isolated clips.
Analysts look for stable behaviours. Does the opponent build through one pivot or split with both full-backs? Do they create from wide overloads or central combinations? Which defender is most vulnerable when pressed onto the weaker side? The output should be a short list of exploitable patterns.
A useful opposition note tends to look like this:
- Build-up trigger: The centre-back opens body shape to find the weak-side full-back under low pressure.
- Transition risk: The attacking midfield line collapses slowly after losing the ball.
- Set-piece habit: Delivery zones are consistent enough to rehearse against.
For coaches who still use spreadsheets for training plans, cut-ups, and role coding, a resource on data driven decision making in Excel is useful because it shows how structured decision processes can stay practical even without a full custom analytics stack.
MATCH PREPARATION
Once staff identify the pattern, the next question is operational: what changes on the training pitch?
The best match prep reduces complexity. Players don't need twenty opponent facts. They need a handful of cues tied to role and phase. Analysts support this by matching evidence to exercises. If the opponent is vulnerable when forced backward into the weak-side half-space, training should rehearse the press trigger, the supporting jumps behind it, and the distances needed for counterpress security.
The workflow succeeds when the analyst can express a game plan in coaching language, not model language.
This is also where many clubs fail. They produce detailed reports, then hand coaches a document instead of a decision. The more useful model is narrower: one page for staff, a few clips for players, and drills that mirror the likely match problem.
A deeper library of examples on football data analysis articles can help readers see how analytical ideas are translated into tactical interpretation rather than left as isolated metrics.
PERFORMANCE REVIEW
Post-match analysis should test execution, not just outcome.
If the plan was to lock central access and force circulation wide, the review asks whether that happened. If the aim was to create cutbacks through the right half-space, the review checks spacing, timing, and reception quality. A win can still hide structural issues. A draw can still contain strong process.
A clean review often separates findings into three buckets:
| Bucket | Key question | Typical response |
|---|---|---|
| Plan matched reality | Did the opponent behave as expected? | Keep and refine the prep model |
| Execution issue | Did players recognise the cue but fail the action? | Train detail and timing |
| Model issue | Was the original read wrong? | Rewrite assumptions before the next cycle |
The strongest departments don't chase total certainty. They build a repeatable loop that improves the next decision.
CASE STUDY MANCHESTER CITYS ANALYTICAL DOMINANCE
On Monday morning, the useful question at Manchester City is rarely, "How much of the ball did we have?" The essential question is whether the week's data explains why the game was controlled, where control slipped, and which training adjustments will matter before the next fixture.
City are a useful case study because their analysis is tied to a demanding game model. The staff are not collecting numbers to decorate reports. They are checking whether positional play created the right receiving angles, whether the press arrived on the correct cue, and whether rest defence was set before the risky pass went in. At elite level, those details decide whether territorial dominance becomes repeat pressure or an exposed transition.
A FRAMEWORK FOR READING ELITE PERFORMANCE
A practical way to read City is Bill Connelly's Five Factors model, outlined earlier in the article. The categories are still useful here because they connect cleanly to football actions coaches recognise on video.
- Explosiveness: Can City break a compact block with one run, one third-man combination, or one switch that isolates a full-back?
- Efficiency: Do possessions move the opponent without slowing the attack with extra touches or safe passes that change nothing?
- Field Position: Is the ball being recovered high enough to keep the opponent pinned and shorten the distance to goal?
- Finishing Drives: Do long spells around the box end with cutbacks, central shots, and second-ball pressure?
- Turnovers: When City lose it, are they already placed to stop the counter within the next pass or two?
That framework helps because it follows the actual coaching workflow. Analysts tag the pattern, coaches check the clips, then the staff decide whether the issue sits in structure, timing, or player execution.
City also show why single metrics need context. High possession alone can flatter a team that circulates safely in front of a block. City's best matches usually combine three things at once: stable rest defence, clean access into the half-spaces, and immediate pressure after loss. If one of those layers drops, the match can still look dominant on the surface while becoming less controlled underneath.
HOW THE CITY PROCESS WORKS IN PRACTICE
The interesting part is the chain from data to decision.
Start with the opponent. Analysts build a picture of where transitions begin, which side carries more of the build-up load, how the back line reacts to width, and what kind of entries produce shots against them. That information only matters if it changes training. Against a side vulnerable to cutbacks, the coaching emphasis may shift toward wide overloads and box occupation. Against a side that break quickly through one channel, the emphasis may move to rest-defence spacing and counterpressure distances.
Then City turn the numbers back onto themselves. If the model says the six must protect central access during the attack, analysts review whether that player held the right supporting position when the full-backs advanced. If the wingers are meant to pin the back line before underlaps arrive, the review checks whether width was held long enough for the pattern to work. Event data starts the conversation. Video finishes it.
A good example of that match-specific approach appears in this Manchester City versus Leeds United tactical statistical preview, where defensive exposure, counter-attacks faced, and duel profiles are all framed as tactical problems rather than isolated stats.
WHY CITY'S ANALYTICAL EDGE SHOWS UP ON THE PITCH
City's advantage comes from alignment. Recruitment, match analysis, training design, and in-game review are pulling toward the same football ideas.
That matters because there is always a trade-off. More aggressive occupation between the lines can improve chance creation, but it can also weaken the structure behind the ball if the rest defence is poorly set. Committing an extra player to the last line can increase box presence, but it may reduce security against the first pass of the counter. Good analysis does not remove those tensions. It helps staff choose which risk is worth taking against a specific opponent.
Role analysis is a big part of that. Guardiola's teams ask one player to solve different problems in different phases. A midfielder may offer an angle in build-up, protect the centre when the ball travels wide, then arrive around the box after a regain. The staff need to know whether the player completed the assignment, not just whether he had a high pass completion rate. That is the gap between reporting and performance analysis.
The lesson from City is straightforward. Analytics has value when it tightens the link between the game model and the weekly work. The clubs that gain most from data are not the ones with the most dashboards. They are the ones that can turn a pattern on screen into a coaching point on Tuesday and a better decision on Saturday.
CONCLUSION ACTIONABLE INSIGHTS FOR EVERYONE
Football analytics works when it makes football simpler, not when it makes discussion more complicated. The best analysts reduce clutter. They identify the patterns that matter, express them in coaching language, and connect them to repeatable behaviour on the pitch.
The next shift will likely push this even further. Beyond current staples like xG, the field is moving toward AI and machine learning, including computer vision and injury-prediction applications, with the next 12–24 months described as a likely inflection period in this discussion of scouting, analytics, and emerging AI tools. That doesn't remove the need for coaches and analysts. It raises the value of people who can interpret, filter, and operationalise what those systems produce.
FOR THE COACH
- Start with one match problem: Pick a single recurring issue such as poor rest defence, weak final-third creation, or broken pressing distances. Build analysis around that problem rather than trying to track everything.
- Tie metrics to drills: If the concern is pressing compactness, rehearse the cue, the support angle, and the second-ball positioning. If the concern is chance quality, train the entry patterns that produce better shots.
- Review process before result: A clean 1-0 win can still hide a flawed structure. Judge whether the intended tactical behaviours appeared, not just whether the scoreline was favourable.
FOR THE ASPIRING ANALYST
- Learn to translate: The technical part matters, but the communication part decides whether the work gets used. A coach should understand the takeaway immediately.
- Build around video: Metrics alone are rarely persuasive. Pair every finding with match clips that show the tactical meaning.
- Develop practical workflows: Clean tagging, searchable libraries, and consistent reporting formats matter more than flashy visuals that nobody uses twice.
FOR THE INFORMED FAN
- Watch for patterns, not just totals: A team with fewer shots may still create the better chances. A side with less possession may still control transition moments.
- Ask better questions: Instead of “Who had the ball more?”, ask “Who controlled central spaces, field position, and the quality of chances?”
- Treat metrics as tools, not verdicts: Analytics can sharpen debate, but football still needs context, opponent style, and role interpretation.
Analytics in football isn't replacing football knowledge. It is organising it. The clubs that gain most from it are the ones that build a full chain from observation to evidence to decision, then repeat that process every week with discipline.
For readers who want that kind of sharp, football-first analysis focused on one elite environment, Manchester City Analysis is worth following. It turns complex tactical and analytical ideas into clear match-level insight for coaches, analysts, and supporters who want to understand why City play the way they do.